theolove2021
New member

In this particular scenario, the trend line structure was broken through again, and price re-tested the trend line to hold as new support.
Again, on this re-test event there was a strong looking rejection candle buy signal, generating a nice bullish follow through move.
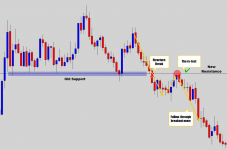
The chart shows a strong structure level that was breached.
Notice how the market came back up to re-test the technical level it broke out from, and the level was respected as new resistance.
I call this the ‘breakout and retest’ event and it basically creates a ‘sweet spot’ for swing trading opportunities.
Keep Trusting the Process. Success in not a fantasy, it is a formular.
To your Success,
Theophilus S.