Forex Gold is back to soar and recorded a new all-time high

FXOchartist

Verified member
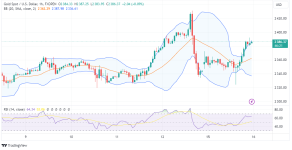
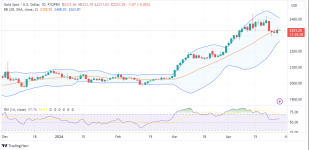
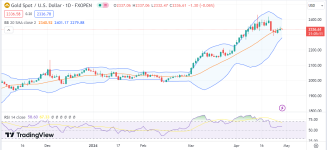
Gold prices soared and reached a new all-time high yesterday. The price has formed a new all-time high at $2379 before rebounding to $2376. On Wednesday the CPI data provided support for the strengthening of the dollar where the actual value of the CPI was 0.04% higher than the expected value of 0.03%. After the CPI was released, many USD pairs weakened against the US dollar, including gold which fell to $2319 from $2360. However, the strengthening of the USD did not seem to last long, because the price of gold then soared to a record new all-time high once again. The price of gold is back to recording a new all-time high throughout 2024 at $2379.

2pBtpxp.png
 

moonchild

VIP Contributor
Gold is probably going to keep on flying higher lol, anyone that saw the sharp drop yesterday at London open will probably think we're in for a bearish run only for gold to turn around and start running upwards like it's on a mission, that's why I find it extremely difficult to be a swing trader because you'll be happy a trade is going in your favor only for the trade to reverse and go against you completely and hit your stop loss.

All I'm doing currently is to scalp gold and that's what I'll be doing till I see a really good place to swing it on the chart, what about you?
 

FXOchartist

Verified member
Gold price is highly volatile, this time the price has formed a pin bar, and we see the gold price drop to form a bearish candlestick with a long tail on the top of the candle. Maybe in this phase, the price will consolidate next week.
 

FXOchartist

Verified member
Gold price is trading at $2353 on MT4. The price is still forming a small bull candlestick pattern containing small shadows on the top and bottom of the candle.

Today gold rose 0.4% from a low of $2346 and formed a high of $2372. Even though there was a strong decline after gold formed an all-time high, the candlestick pattern still formed a lower high, which means the bullish pattern was still not broken.

On the daily timeframe the price moves below the upper band with the Bollinger band line expanding indicating high market volatility with a bullish sentiment pattern.

Another indicator is the 50 moving average measuring the past 50-day time period forming an upward channel above the lower band line.
Meanwhile, the RSI used to measure the overbought and oversold zone shows level 73, meaning the price is in the overbought zone.

xauusd-d1-fxopen-investments-inc-2.png
 

FXOchartist

Verified member
According to data from Goldprice, the change in gold prices in 30 days rose +181.08 with a change of +8.38%. In six months it rose +423.34 with a change of +22.05%.

Kitco Metals senior analyst Jim Wyckoff, said, gold continues to strengthen sharply, even though the US dollar index and US Treasury yields are rising, which shows the strength of gold. "That's very indicative of strong safe-haven demand.”

Goldman Sachs raised its gold price forecast at the end of this year to US$ 2,700 per troy ounce, from the previous US$ 2,300.

GOLD 16 04 2024 H1 TV.png
 

FXOchartist

Verified member
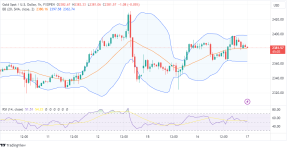
Even though it is still difficult to break 2400, today's gold price rose slightly by 0.10%, with the price range in 24 hours forming a low of 2,382.89 and a high of 2,387.10. The price of gold formed a doji candle

Gold's performance in 30 days according to Goldprice.org data still had a gain of 15.23%, while in 6 months the gain was 26.58%.

The escalation of war in the Middle East may continue in the long term after Iran attacked Israel with a number of cruise missiles and ballistic missiles. Israel vowed to retaliate against the attack despite US efforts to reduce the risk of regional escalation.

Gold is included as a safe-haven asset because of its timeless intrinsic value.

The value of gold is often related to the USD. When the USD weakens, gold tends to rise, whereas if the USD strengthens, gold tends to weaken.

gold 17 04 2024 h1.png
 

FXOchartist

Verified member
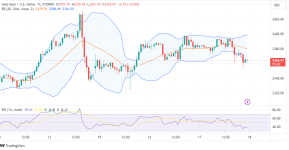
Yesterday's gold price formed a bearish candlestick with a high of 2395 and a low of 2354. Even though it fell, it has not break the bullish structure marked by the MA line which forms an upward channel below the price.

Today gold gained 0.25% slightly up to the price level of 2367, the price of gold still has the potential to rise but the RSI at level 70 gives an alert that the price is in the overbought zone.

The escalation of war in the Middle East adds to global concerns which often have an impact on financial markets, the price of gold is estimated to still be sought after by investors as a safe haven asset and also central banks that buy gold as reserves as is done by China's central bank which buys up gold throughout the year can contribute to the increase gold price followed by other central banks, although the largest demand is the People's Bank of China (PBC).

gold 18 04 2024 h1 tv.png
 

FXOchartist

Verified member
Gold prices are expected to continue to soar as the safe haven asset benefits from the turmoil occurring in the Middle East. Meanwhile, Jerome Powell refused to guide when interest rates might be lowered. Apart from geopolitical factors, gold prices are also often influenced by the value of the USD.

According to Investing, the dollar strengthened against several world currencies as data confirmed the US economy was in strong condition, supporting the idea that the Fed could delay its first interest rate cut.
Treasury yields neared their highest level since November as solid economic data reinforced warnings from Fed officials that the decline in inflation may be stalling.

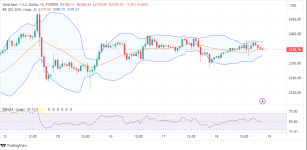
Bollinger band squeeze waiting for breakout.

GOLD 19 04 2024 d1 tv.png
 

FXOchartist

Verified member
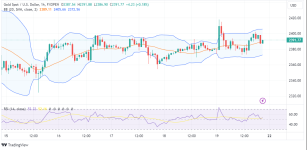
Gold price is now trading between the upper and middle band lines with the Bollinger band line drawing an ascending line with wide bands indicating an uptrend with high volatility.
Price movement in the last week has tended to be consolidation with the $2400 peak becoming solid resistance during last week's trading period.
The public is still waiting for the Fed to cut interest rates, but it seems that Powel has not given a signal of a cut in the near future, causing market speculation amid heated tensions in the Middle East.

Strategists at MRB Partners said they would not increase gold exposure in the next 6-12 months due to uncertainty over expectations of the Fed cutting interest rates.

Gold 22 04 2024 h1 tv.png
 

FXOchartist

Verified member
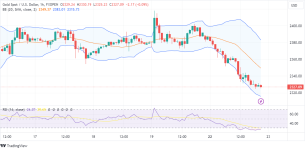
Gold prices fell 2.7% days ago and formed a Morubozu candle. This candle pattern is hoped to be a strong reversal pattern supported by gold fundamentals.

In recent weeks, geopolitical tensions in the Middle East and war elsewhere have triggered gold prices to move upward until they reach a new all-time high.

However, as is the nature of market trends, there will be price reversals in a trend as seen yesterday gold prices plunged 2.7% from $2388 to a low of 2324.

On H1 timeframe gold price moves near the lower band line. Here the Bollinger bands draw a downward channel with wide bands indicating high market volatility in a downtrend.
The MA 50 indicator draws a descending channel above the middle band line reflecting the market downtrend in this timeframe.
The RSI indicator currently shows level 26, meaning the price has entered the oversold zone, giving an alert of a possible reversal.

gold 23 04 2024 h1 tv.png
 

FXOchartist

Verified member
Citigroup Inc. has raised its average price prediction in 2024 to US$2,350 and in 2025 it is estimated at an average of US$2,875.
Goldman Sachs Group Inc. also raised its forecast to $2,700 in 2024 and UBS Group predicted $2,500 by the end of the year.

Even though gold prices fell sharply yesterday, investors still have reasons to choose gold as a safe haven asset. Inflation that may increase and global tensions in the Middle East are global geopolitical issues and China's demand expectations.

GOLD 24 04 2024 H1 TV.png
 

FXOchartist

Verified member
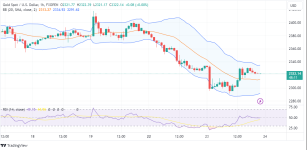
Gold prices fell to a low of $2391 on Tuesday, but rebounded and tried to rise despite facing resistance at the $2337 price level. The failure of the breakout caused gold prices to fall but faced important support at $2311. This situation illustrates that the market is still waiting and has the potential for an upside or downside breakout.

The decline in geopolitical tensions in the Middle East is suspected to have caused gold prices to be trapped in a consolidation phase. On the other hand, the Fed may not cut interest rates shortly, which is also a concern for analysts.

Even though there are currently no signs of an escalation of war, geopolitical uncertainty still has the potential to loom large so that gold could rise quickly at any time.

Gold 25 04 2024 h1 tv.png
 

FXOchartist

Verified member
Even though it rose to the price level of $2344, gold still failed to continue its upward trend. Price back to decline at $2332 level price.

Citing to Investing, US durable goods data for March was released, rising from 0.7% the previous month to 2.6%, slightly above expectations of 2.5%. The previous month's figure was revised down from 1.3% to 0.7%. Meanwhile core durable was at 0.2%, tending to be in line with expectations, but up slightly from the previous 0.1%.

Gold did rise when the data was released, but was unable to maintain this increase as the market was still worried about the GDP report and also the PCE on Friday. The continued weakening of the Japanese Yen may make the market think that the BoJ will intervene in currency involving the USD, thereby affecting gold prices.

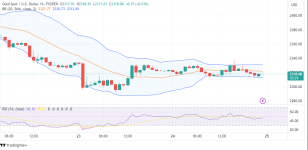
Bollinger band squeeze appears which indicates low market volatility in H1 timeframe. Expected break upside.


Gold 26 04 2024 d1 tv.png
 

FXOchartist

Verified member
Monday's gold price seemed reasonable without a gap, although it fell slightly, it was still trading at a higher high. According to a Morgan Stanley analyst, The path forward for gold prices will be choppy but likely towards higher highs, rather than a reversal, he predicts gold prices could reach $2760 this year.

I see a decrease in volatility referring to the narrowing Bollinger band line. The possibility that the Fed will not increase interest rates shortly may affect gold in the short term.

gold 29 04 2024 d1 tv.png
 

FXOchartist

Verified member
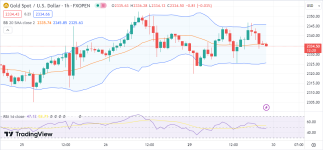
Today's gold price tends to remain stable within the daily range. In yesterday's trading, the price of gold fell from a high of 2346 to a low of 2319. Seems the market is still waiting for the Fed's decision which may still maintain high interest rates because inflation is still at a persistent high. Meanwhile, yesterday's Japanese Yen intervention did not seem to have much influence on gold prices. Gold forecast, analysts from TD Securities predict gold prices will move lower in the short term but only last until autumn.

gold 30 04 2024 h1 tv.png
 
Top