Forex News & Analysis NordFX broker: News, Weekly Analytics

Stan NordFX

Active member
December 2020 Results: NordFX's Most Successful Trader's Profit Exceeds $100,000


NordFX brokerage company has summed up the performance of its clients' trade transactions in December, last month of the past year 2020.

The highest profit in December was received by a client from China, account number 1345xxx. His profit exceeded the milestone of 100,000 and amounted to 107.654 USD. This impressive result was obtained mainly in transactions with the EUR/USD, GBP/USD currency pairs and gold (XAU/USD).

In second place is a trader from India (account number 1518xxx), whose profit amounted to just under 40 thousand dollars (39.506 USD), and was obtained through trading in many pairs, primarily GBP/USD and GBP/JPY, as well as operations with altcoin No.1, Ethereum (ETH/USD).

The third place in the December TOP-3 belongs to another Chinese trader (account No.1465xxx), with a result of 38.409 USD, who also made transactions with the British pound and gold, GBP/USD and XAU/USD.

The passive investment services:
  • in CopyTrading in December, the Mak jemah signal (increase of 111.06% with a fairly serious maximum drawdown of 37.12%) attracted attention, as well as KennyFXPRO (an increase of 27.61% with a moderate drawdown of 6.65%);
  • in the PAMM service, the results are more modest. Here the leader was the manager with the nickname The Owl Midnight Scalper, who showed an increase of 18.43% over the month. However, the drawdown here was significantly lower, only 2,39%, which can be attractive for investors who prefer stable income with a moderate degree of risk.

Among the IB partners, NordFX TOP-3 is as follows:
  • the largest amount of commission, USD 8.425, was accrued to a partner from Sri Lanka, account No.1483xxx;
  • next is a partner from India, account number 1491xxx, who received 5.991 USD;
  • and finally, the top three in December 2020 is closed by another Indian partner, account No.1328ххх, who received $5.704 as a reward.


Notice: These materials are not investment recommendations or guidelines for working in financial markets and are intended for informational purposes only. Trading in financial markets is risky and can result in a complete loss of deposited funds.

#eurusd #gbpusd #usdjpy #btcusd #ethusd #ltcusd #xrpusd #forex #forex_example #signals #cryptocurrencies #bitcoin #stock_market

Forex | Forex Trading - NordFX
 

Stan NordFX

Active member
MACD Overview

This indicator is sometimes mistakenly considered an oscillator. This is not the case, because it is based on price averaging. The MACD algorithm is based on the convergence and divergence of two Moving Averages, and the histogram shows the distance between them. So MACD, unlike Stochastic or RSI, is not a stochastic oscillator, but a classic trend indicator (Fig. 3).

vTSzU7F.jpg


It is a huge source of signals, as it is able to find short-term and medium-term changes of the trend, generate signals to change the global trend. Its most formidable weapon is divergence. It has become a common signal for a huge number of Forex indicators.

Divergence is a reversal type of signal that is formed due to the mismatch of the extremes of the instrument with the real price. Simply put, if the price curve is still going down, and the indicator curve has already turned upstairs, this is a strong signal that the trend reversal should soon be expected. Thus, MACD, like other reversal indicators, is able not to post facto, but to warn in advance about fractures in price movements. The example is given in Figure 4:

Nl7ScVq.jpg


You can see divisions above and below the 0.00 mark on the histogram. At moments when the graph crosses this zero line, a global trend change is fixed. It is clear that if the intersection occurs from bottom up, then the trend has changed from downward to rising. Accordingly, at the reverse level crossing, the trend changes from ascending to descending.

Also note how the MACD histogram interacts with the signal red dotted line. Their intersection generates a signal of a short-term change in the price movement and helps to determine the moment for opening orders either for buy or sell (Fig. 5).

FmLN3ut.jpg


Some Forex traders use this indicator not only together with other technical analysis tools, but also on their own. This is explained by the strength and accuracy of the MACD signals, especially if divergence occurs on the chart.
 

Stan NordFX

Active member
Support and Resistance Levels: Types, Methods of Construction, Usage Cases


Technical analysis in the Forex market provides a wide range of opportunities to study and predict prices. The number of instruments that are capable of solving the tasks set by the trader is hundreds. If the indicators are justifiably amenable to criticism for signal lagging, the levels of support and resistance find their admirers even among people most skeptical towards technical analysis. This is not surprising. Forex levels are a benchmark that all traders, without exception, pay attention to.

Levels are abnormal zones on the price chart, near which there are sharp changes in the dynamics of quotations. Thus, when the price approaches the levels, there is a noticeable response: bounces, reversals, breakouts, acceleration or deceleration of quotes . Since this happens with enviable consistency, the trader has the opportunity to create trading strategies based on such levels. Trading with their help becomes active, impulsive and allows you to fix a good profit in a short time frame.

The Reason Why Markup is Effective

Trading in the financial markets is carried out using a huge number of instruments. However, there are only two key areas in the analysis - technical and fundamental. Textbooks on them are written and regularly published in all languages of the world. This creates a unified learning base for all traders and investors. Therefore, guided by a similar algorithm of actions, the vast majority of traders will, like you, see Forex levels and push quotes in their direction.

In addition to the same algorithm of actions, do not forget about the convenience of calculations. For example, when a trader chooses a place to place Stop Loss , it is easier for them to focus on round levels. This is convenient, because in the heat of active trading there is no time for the perfect calculation of points - everything is rounded one way or another.

The third argument is monetary policy. Each head of the Central Bank and the government sets a price corridor, which is the basis of the budget. Out-of-bounds always result in the intervention of the regulator.

Types of Levels and Their Differences

There are many ways to calculate levels, and as a result, their types. If we generalize them conditionally, we can distinguish the following main groups: horizontal, sloping, dynamic. The key difference between them is in the way they are built, and the number of elements required for this.

Ways to Build Horizontal Levels

To do the markup, your trading platform must have drawing tools. Broker NordFX offers its clients to use the world's most popular platform - MetaTrader 4 (MT4). Its graphical toolkit, among other things, includes horizontal lines.

Resistance and support are built on historical points where rebounds have occurred more than once in the past. The support level is drawn through local lows, and the resistance level is drawn through local highs.

For many, the debatable question is at what prices to draw the line. There is no basic difference. The level is marked both by the body of the candle and by its shadow. There is a concept of a zone, so a deviation of several points is the norm. Moreover, the higher the timeframe, the wider this zone will be.

An example of how horizontal Forex levels are marked in Fig. 1:
KN1Rw8K.jpg

Sloping levels

These levels are no different from the previous ones, as far as their impact on price is concerned. The main difference is the angle of the lines. They are drawn at local lows/highs and completely depend on the direction of the trend. The main rule when applying is that the price should bounce. Two points are enough to draw this level. This is a simple geometric rule for drawing line segments.

In literature, they are also called the trend line. If you draw such lines parallel to each other, you can identify price channels. An example of one of them can be seen below in Fig. 2:
zwpvssd.jpg

They are used for only one purpose - to find the entry point. It is difficult to set price targets according to them. By the way, when working with sloping levels, the extremes should be consistent, namely, above each other (for an upward market) or below (for a downward one).

Dynamic

In the classical understanding, levels are manual markup. However, progress has gone far from the textbooks of the 80s and 90s of the last century. In addition to markup, indicator techniques are gaining popularity: Moving Average, Envelopes, Donchian Channel, Bollinger Bands.

Their main feature is that they are volatile and are rearranged following the price. This is both their strength and weakness.

The principles of building the horizontal and dynamic level are different, but the properties and principles of use are the same. As an example (Fig. 3), we propose to study the most famous of them, Moving Average, and working it out as a level:
yNnVl8I.jpg

The Difference Between Support and Resistance

Beginners sometimes find it difficult to clearly define what support is, and mistakenly call it resistance, and vice versa. They have the same properties in terms of trade practice. Quotes bounce off them, and accelerate sharply after the breakout. However, the difference still exists: it is the position of the price relative to the level.

Support is the level that the price relies on during its movement. It connects important lows and occurs when traders can no longer, or do not want to sell this financial instrument at lower prices. Resistance, on the other hand, is a level that connects important highs (tops) of the market and stands in the way of growth, preventing the price from going up.

In both cases, it is important in what trend the markup is considered. They can change places during a breakout. An example of how support turns into resistance is shown below (Figure 4):
7lRMYdD.jpg

How to Build Forex Support and Resistance Levels

You can build levels on charts of any timeframe in different ways. Professionals often and quickly do this manually using the auxiliary charting tools built into the MT4 terminal. However, it is difficult for beginners to find extremes. To simplify their detection, auxiliary indicators such as, for example, Fractals or ZigZag are used, which automatically highlight local lows/highs.

Pivot, Murray, Fibonacci formulas are also used to calculate support and resistance levels. They are implemented as separate user indicators. It should be noted that there are many other indicators that apply all types of markup without your involvement. Many of them are already integrated into MetaTrader 4, making market analysis much easier.

How Levels Are Used in a Trading Strategy

Patterns in price movements near support or resistance make it possible to use them for different purposes. One of the most important purposes in developing a trading strategy is the signal function. Trading in this case occurs both on a rebound from the level, and on its breakdown. There is also a mixed type of trading, which includes other signals for opening or closing positions as well.

The ways of trading at levels can be very different. Conservative trading , advocated by many textbook authors, involves working in the direction of the trend, while aggressive trading involves opening positions in both directions or against the trend. Each technique has a right to exist, but one should consider how strong the level is. The probability of a breakout of a strong level is extremely low, so rebounds are practiced in this case. Weak levels , which have only a couple of touches, are overcome by the price like a knife in butter. Therefore, the probability of a breakdown of a weak level is quite high. Although false breakouts often occur on Forex - cases when the price seems to have already overcome the support or resistance zone, but instead of going further, it turns back and returns to its previous positions.

At moments when the strength of traders playing to raise and lower the price is roughly equal, there can be price consolidation. If you see that the price is being squeezed like a spring - consolidation is there for you. And we can expect that at some point this spring will be open, which will lead to the appearance of a sharp impulse in the change in quotes and an increase in volatility.

Setting Stop Loss and Take Profit

According to many traders, a trading strategy without using Stop Loss is a time bomb. Beginners find it difficult to choose where to place it on the chart, because there is a possibility that the price will accidentally hook it. And it is very disappointing to see how your order closes with a loss by Stop Loss, after which the price will reverse and go in a direction that is profitable for you. That is why it is customary to place Stop Loss beyond the nearest level at a distance of several points from it. Recall that this distance depends on the timeframe you are working on. The higher the timeframe, the greater that distance must be. Thus, on the H4 time frame and above it is measured by dozens of points, forming not a line, but a support/resistance zone. It may also depend on the selected Forex currency pair, as well as the current volatility of the market.

Also, in addition to Stop Loss, levels are used to solve one more task - to determine a price target for profit fixing. Take Profit at the opened trade is placed on a similar principle, which is described above. However, it is put on the open order direction, rather than against it. And here, again, the concept of a zone must be taken into account, because just as the price can slip several points beyond the level (false breakout), the same few points will not reach it.

A huge number of trading strategies have been created at the support and resistance levels of Forex, the effectiveness of which is also influenced by a number of other factors. This is the accuracy of quotes, the size of spreads, the speed of execution of trades, etc. And here NordFX clients have an obvious advantage, since the trading conditions provided by this broker are among the best on the market.

Strengths and Weaknesses

Working on Forex support and resistance levels has a number of advantages and disadvantages. The cons of their use are as follows:
  • The presence of false breakdowns;
  • The presence of slippage (backlash), which turns a thin line into a support/resistance zone, the width of which depends on many factors: the currency pair being traded, the time frame and the current market situation. All this makes it difficult to set orders and to open and close a trading position.

The strengths of the levels are as follows:
  • They have a lot of information about the dynamics of the market;
  • They allow you to define the price corridor, the market entry and exit points;
  • They are applicable on any timeframe and for any trading instrument;
  • There are many charting tools and indicators that automatically determine these levels. Many of them are already integrated into the MT4 terminal;
  • A huge number of ready-made solutions - scripts and robot advisors that allow you to conduct semi-automatic and fully automatic trading using data levels;
  • Ability to include in any trading strategy;
  • A large number of signals are generated on each timeframe.

Only practice can teach you how to use support and resistance levels effectively. And in order for you to gain the necessary experience without any financial costs, we recommend using a demo account of the NordFX brokerage company. It can be opened for free, and registration will take no more than a couple of minutes of your time.


#eurusd #gbpusd #usdjpy #btcusd #ethusd #ltcusd #xrpusd #forex #forex_example #signals #cryptocurrencies #bitcoin #stock_market

Forex | Forex Trading - NordFX
 

Stan NordFX

Active member
Forecast 2021: Is Bitcoin Worth Investing In?


Is it the "gold of the XXI century" or a soap bubble about to burst? We have repeatedly discussed the advantages and disadvantages of bitcoin over the past year, and analyzed the reasons for its ups and downs. Therefore, we decided to cite only the opinions of experts regarding the prospects for the main cryptocurrency in this review.
You may decide to be patient and invest in bitcoin for a long-term profitability. Or, on the contrary, you do not want to take risks and prefer to forget this word altogether. In general, the decision to buy, sell bitcoin or simply do nothing is always yours.
nezixWX.jpg


Optimists' predictions: Only to the North!

1. Bestselling author of Rich Dad Poor Dad and entrepreneur Robert Kiyosaki is convinced that cryptocurrency will continue to rise to $50,000 next year amid further influx of institutional money. The entrepreneur, having said that “America is in trouble”, precludes the “death” of the US dollar and a “bright future” for gold, silver, bitcoin.
“Bitcoin's rise has outpaced gold and silver,” he wrote. - What does it mean? This means that you need to buy as much bitcoin and precious metal as you can and don't put it off. The train is already leaving. The dollar is dying. When the dollar falls, the price doesn't matter anymore. What matters is how much gold, silver and bitcoins you have.”

2. According to analysts at the JPMorgan Chase banking holding, bitcoin outperforms gold as an alternative currency and has a significantly better chance of continued growth. According to their report, the capitalization of the crypto market is not large enough yet. JPMorgan estimates that the physical gold market, including ETF backed by it, is $2.6 trillion. Bitcoin needs to hit the $130,000 mark to catch up with the precious metal in this respect.
According to JPMorgan Chase, institutional investors can invest up to $600 billion in the first cryptocurrency in the coming years. This requires American, European and Japanese insurance companies and pension funds to invest only 1% of their assets in bitcoin. However, at the moment there are still regulatory requirements for the selection of investment assets in terms of risks and performance of obligations for such traditional investors. This can limit the amount of funds available for buying BTC.

3. The well-known Dutch cryptanalyst PlanB, who developed the popular BTC stock-to-flow valuation model, believes that the price of the reference cryptocurrency may rise to $100,000 by the end of 2021, and maybe up to $300,000. PlanB admits his forecast sounds extremely optimistic. However, the rise in the price of bitcoin in the past allows him to make such predictions.
The expert notes that during periods of market corrections, the algorithms of bitcoin whales pick up hundreds of portions of 0.01 BTC from "weak hands". Later these coins “disappear” in “deep” cold vaults. This leads to a supply shock and triggers a bull market.

4. Scott Minerd, investment director of Guggenheim Investments, considers bitcoin to be a grossly undervalued asset, even at current price levels of around $23,000. “Our fundamental work shows that bitcoin should be worth about $400,000,” he said in a conversation with Bloomberg TV.
Analysts at Guggenheim Investments came to this conclusion based on two factors: the limited emission of bitcoin and its value relative to gold. There are many common characteristics that cryptocurrency shares with the precious metal, Minerd said, but bitcoin, unlike gold, "has extraordinary value in the context of transactions."

5. Popular analyst and founder of Quantum Economics Mati Greenspan believes that “we are at the very beginning of a period of mass investor entry into the cryptosphere. If demand continues to rise and supply is constrained, then there is a possibility that we will see growth of 250% or more." At the same time, Mati Greenspan excludes a scenario in which BTC will soar to $400,000. “The rally will certainly continue, but there is no need to talk about any astronomical figures yet,” the analyst sums up. He believes that, unlike in 2017, the market is now controlled not by speculators but by corporations and large investors interested in its stability. The entry of these large players leads to the fact that volatility will weaken, and this area will become more attractive.

6. Bloomberg experts believe that there is no reason for a change in the direction of bitcoin's movement now, and its cost may increase to $50,000 in 2021. “The dollar is gradually losing its position, ducking other fiat currencies,” writes this authoritative agency, “All this is noticed by investors who are forced to switch to alternative assets.” Bitcoin has significantly more support now, which minimizes the likelihood of a pullback. Open interest in the CME bitcoin futures market has exceeded $1 billion for the first time in history, which also speaks of growing support from investors.
Looking into the longer term, Bloomberg analyst Mike McGlone has suggested that within 5 years the price of the main cryptocurrency could exceed $100,000.

7. A similar point of view is followed by the American billionaire Paul Tudor Jones, head of Tudor Investment Corporation, who said that “cryptocurrencies are facing a crazy flight on a rocket with ascents and descents along the way.” “In 20 years, bitcoin will be significantly higher than the point where it is now. From here, the road for it lies north,” Yahoo! Finance quoted him.

8. The report of the fintech company Cindicator is of great interest. This is due to the fact that the figures presented in it are not the opinion of individual specialists, but the average results of the survey of more than 156,000 participants of the crypto market, according to which bitcoin next year will rise to $29,569. The respondents with the most accurate forecasts, the so-called "superforcasters", expect even greater growth on average, to $32,056.
According to the calculations of the “Hybrid Intelligence” Cindicator, which uses machine learning algorithms to process data from a team of analysts, the BTC rate next year will not exceed $25,222.

9. According to Mike Novogratz, head of the Galaxy Digital crypto trading bank, everyone should invest 2-3% of their funds in bitcoin. “After that, it is enough to wait a little time, and you will be surprised, but cryptocurrencies will cost significantly more. If you wait for five years, the assets will multiply several times,” he wrote.

10. According to experts of Stack Funds, bitcoin is ready to rise to a new high of $86,000.

11. The Director General of Global Macro Investor Raoul Pal expects that even conservative institutional investors, who usually prefer precious metals, will start investing in bitcoin next year. Therefore, Pal made a bold assumption that the rate of the first cryptocurrency could reach $250,000 in a year and placed an order for the sale of all the gold he had in order to invest in BTC and ETH in the ratio 80 to 20.

12. Even more inspiring forecast was given by Gemini crypto exchange founder Tyler Winklevoss, one of the twin brothers who are called the first cryptocurrency billionaires. He said on CNBC that the value of bitcoin could exceed the $500,000 mark.
"The question isn't whether bitcoin will cost $500,000 or not, the question is how quickly it will happen. In fact, even this assessment seems to me very conservative - the game has not really even started," said Tyler's brother Cameron Winklevoss.

13. A similar figure is also called by a member of the Board of Directors of the Bitcoin Foundation Bobby Lee, according to whom the price of the main coin can reach $500,000 by the year 2028.

14. According to experts from one of the shareholders of Tesla, the ARK Invest fund, the capitalization of bitcoin may exceed $5 trillion. This will take the coin up to 10 years, but massive investments can start earlier. This figure could reach $1 trillion in the next 5 years, after which growth will occur at a faster rate.

15. A forecast was presented by Tom Fitzpatrick, Managing Director of one of the largest banks in the world, Citibank. According to him, thanks to consolidation in the status of digital gold, the rate of the first cryptocurrency can reach $318,000 by the end of 2021.
In his new report, Bitcoin: Gold for the 21st Century, Fitzpatrick writes: "Bitcoin moved in the aftermath of the Great Financial Crisis of 2008, when new changes in the monetary regime took place and we dropped to zero interest rates." And further he concludes that currently, financial stimulus measures against the background of the coronavirus pandemic have led to the formation of conditions similar to the 1970s, when the dollar inflation led to the increased demand for gold.

16. Popular TV presenter and Wall-Street veteran Max Kaiser believes that at current levels, bitcoin futures traders are suppressing the price of BTC to give institutional players a chance to "load the boat." However, once the asset reaches the $28,000 mark (the intermediate benchmark set by Kaiser), the number of coins for sale will go zero, and thanks to the deficit, their price will burst up to the cosmic heights.
“For the poor of this world, the current price and availability of BTC,” says Kaiser, “is the only opportunity in life to purchase non-forfeitable hard money before the price of it rises to 40-80 times, and prices will soar to the level of golden parity at around $400,000.”
“The demand for bitcoin is growing almost exponentially,” he says, “while its supply is mathematically fixed at 900 coins per day. And in 2024, the supply will be halved to 450 BTC per day. That's why I think people simply won't have the opportunity to buy coins, since the price can soar even to $1,000,000 per BTC. Meanwhile, Gen Z, who bought a lot of bitcoins when they were under $100, will become the new global power elite. The world order is about to change...”


Pessimists' Predictions: A Fly in the Ointment

1. Despite the optimism in general, Galaxy Digital CEO Mike Novogratz believes that bitcoin instability can be expected in the near future. Its price in 2021 will certainly not return to zero, but could fall to the $14,000mark, or even $12,000. Although a correction to such levels is unlikely, investors need to be prepared for losses of 30-40%.

2. According to the average forecast of fintech company Cindicator, the lower bar of the trading range for the BTC/USD pair in 2021 will be at the level of $15,000. “Superforcasters” are less optimistic and expect a decrease to $12,000, and according to the calculations of “Hybrid Intelligence” Cindicator, the bitcoin rate will not go down next year below $16,000.

3. Matt Maley, strategist at financial services firm Miller Tabak, believes the cryptocurrency market will face a major setback next year. According to him, the main coin may fall in price by about 25-30 percent in the first months of 2021. According to Maley, the market is overheated due to large-scale investments, which is why corrections by one or several thousand dollars may become a norm.
“I consider cryptocurrencies to be a promising asset, but the minimum correction size next year will be 10%. At the same time, the fall may be at the level of 30% or even more. Therefore, it is worth being prudent before large-scale investments,” the specialist warns.


NordFX Analytical Group


Notice: These materials should not be deemed a recommendation for investment or guidance for working on financial markets: they are for informative purposes only. Trading on financial markets is risky and can lead to a loss of money deposited.

#eurusd #gbpusd #usdjpy #btcusd #ethusd #ltcusd #xrpusd #forex #forex_example #signals #cryptocurrencies #bitcoin #stock_market

Forex | Forex Trading - NordFX
 

Stan NordFX

Active member
Happy New Year, 2021!

c54hO8T.jpg

Dear clients and partners! We extend our warmest congratulations on the upcoming holidays.

The outgoing 2020 turned out to be not the easiest one for most of us, requiring resilience, a lot of effort and energy. It has been a difficult time, but we are confident that together we can overcome any difficulties.

Let the coming year be the year of new joint victories and achievements. Let all adversity and troubles remain behind us, and only prosperity and success lie ahead.

Let all your hopes and dreams come true in the new year. We wish you and all your loved ones good health, prosperity, endless joyful smiles, and optimism!

Happy New Year!

Forex | Forex Trading - NordFX
 

Stan NordFX

Active member
As for the forecast for the coming week, summarizing the opinions of a number of experts, as well as forecasts made on the basis of a variety of methods of technical and graphical analysis, we can say the following:

- EUR/USD. Next week on Thursday, December 24, Forex trading will end at 17:00 CET, and there will be no trading at all on December 25, Christmas. (please visit the NordFX website, the Company News section for details on the trading schedule during the Christmas and New Year holidays in the currency and cryptocurrency markets, as well as on CFD contracts).
The end of the year is a period when big players close their positions, sum up and go on vacation. But it is at this point of low liquidity in the market, as already mentioned above, that traders need to be prepared for sudden surprises. And it is not necessary that they will be as pleasant as gifts from Santa Claus. The main surprise may be the agreement between the EU and the UK on the Brexit terms (or lack thereof).
At the time of this writing, 95% of the trend indicators on H4 and 100% on D1 are green. Also, 75% of oscillators on both timeframes look up. However, the remaining 25% signals that the pair is overbought, and a correction is possible.
Graphical analysis on H4 predicts the movement of the pair in the trading range of 1.2175-1.2300, and D1 indicates the possibility of its growth to the height of 1.2355. 80% of experts support this development. The remaining 20% expect the pair to decline to support 1.2100, and in the transition from weekly to monthly forecast, the number of bear supporters increases to 65%. Closest supports are at 1.2055 and 1.1900 levels.
EURUSD 21.12.jpg

- GBP/USD. As we wrote last week, there are three possible options regarding Brexit.
1 - neutral soft. It is a decision to extend the current terms of the transition period for another six months or a year in order to gradually move to rules similar to the basic rules of the World Trade Organization. In this case, a catastrophic collapse of the pound would be avoided, although the pair would go south. The nearest support level in this case is 1.3275, then 1.3100, 1.3000 and 1.2850.
2 - the “hardest” Brexit, without any agreements or prolongations, which will lead the pair to fall first to the 1.2700 horizon, and over time, possibly to the lows of May 2020. in the area of 1.2075-1.2160.
3 - the conclusion of a full-scale deal between the EU and the UK. In this case, we will see a rise of the pound first to the height of 1.3500, and then perhaps to the highs of 2018 in the area of 1.4350.
We will know soon which of these options will be chosen;

- USD/JPY. 90% of oscillators and 100% of trend indicators on D1 are still colored red, expecting further decline in the pair within the descending medium-term channel. As for analysts, they, supported by graphical analysis on H4 and D1, they consider most likely the pair to move in the trading range 102.70-104.00, that is, between the central and upper boundaries of the designated channel;

- cryptocurrencies. So, is it worth waiting for a repeat of the "crypto winter" of late 2017 - 2018? Or, after a slight correction, the BTC/USD pair will again rush to new heights?
Bestselling author of Rich Dad Poor Dad and entrepreneur Robert Kiyosaki is convinced that cryptocurrency will continue to rise to $50,000 next year amid further influx of institutional money. The entrepreneur, having said that “America is in trouble”, precludes the “death” of the US dollar and a “bright future” for gold, silver, bitcoin.
The well-known Dutch cryptanalyst PlanB, who developed the popular BTC stock-to-flow valuation model, believes that the price of the reference cryptocurrency may rise to $100,000 by the end of 2021, and maybe up to $300,000. PlanB admits that his outlook sounds extremely optimistic and even somewhat amusing for some investors. However, the rise in the price of bitcoin in the past allows him to make such predictions.
According to analysts from the financial conglomerate JPMorgan Chase, institutional investors can invest up to $600 billion in the first cryptocurrency in the coming years. This requires that American, European and Japanese insurance companies and pension funds invest only 1% of their assets in bitcoin.
As JPMorgan lead strategist Nikolaos Panigirtzoglou noted, the recent $100 million investment by Massachusetts Mutual Life Insurance Company marks another milestone in the adoption of the first cryptocurrency by such organizations. At the same time, the analyst admits that it is quite difficult for such traditional investors to invest in cryptocurrency, since there are still regulatory requirements for the choice of investment assets in terms of risks and fulfillment of obligations. This can limit the amount of funds available for buying BTC.
In general, the topic of the attitude of government regulators to cryptocurrencies is one of the key factors for the development of this market. This issue has been actively discussed at the recent BlockShow conference. The speakers said that although decentralized finance needs to communicate with regulators, it cannot be full concessions to them. If we introduce complete regulation of the market, then it will hardly differ from fiat.
Now about the prospects of the BTC/USD pair for the next few weeks. According to the average forecast, the probability of its rise to $25,000-26,000 is estimated at 30%, above $30,000 - 10%. As for the fall, the probability that the pair will decrease to the $18.500-20,000 zone is 20%.
As for altcoins, those who at this stage are wary of investing in bitcoin may pay attention to ethereum. If BTC has already exceeded its 2017 high by 16%, then ETH is still to grow from its current values in the region of $670 to its all-time high of $1,420. And this despite the fact that this main altcoin showed better dynamics than bitcoin this year: it has added 640% from the March low against 465% for BTC.
In addition, altcoin blockchain No.1 has recently been updated. Ethereum 2.0 has made the cryptocurrency safer, more efficient, scalable and, hopefully, potentially more profitable.
And here it is necessary to recall the recent warning of the co-founder of ethereum Vitalik Buterin, who urged not to get into debt or take out loans to buy any digital assets, be it bitcoin, ethereum or any other coins. He said he had “only a few thousand dollars of net equity” before Ethereum was created. “However, I sold half of my bitcoins to be sure I would not break up if the rate fell to zero,” he writes.


NordFX Analytical Group


Notice: These materials should not be deemed a recommendation for investment or guidance for working on financial markets: they are for informative purposes only. Trading on financial markets is risky and can lead to a loss of money deposited.

#eurusd #gbpusd #usdjpy #btcusd #ethusd #ltcusd #xrpusd #forex #forex_example #signals #cryptocurrencies #bitcoin #stock_market
 

Stan NordFX

Active member
Forex Forecast and Cryptocurrencies Forecast for December 21 - 25, 2020


First, a review of last week’s events:

- EUR/USD. According to Bank of America Merrill Lynch, the most popular strategy in the market after “buy shares” is “sell the dollar”. Speculative short positions in this currency have risen to a two-year high. The USD index (DXY) has fallen below 90, while it was at 102.82 on March 15, 2020. As for the retreat of the dollar in recent days, it is taking place against the background of the discussion in the US Congress of an additional package of fiscal stimuli. After all, every new dollar poured into the country's economy will lead to a decrease in its purchasing power.
The Federal Reserve meeting held on Thursday, December 17 had virtually no effect on market sentiment. The interest rate remained at the same level, and, one might say, a blissful pre-Christmas mood prevailed at the press conference: nothing new was said about the prospects for further quantitative easing and no worries about the current state of the economy were voiced. Although, perhaps, such passivity was caused not only by Christmas, but also by the change of the US President. The new owner has not yet settled in the White House. And the old one is already a duck lame on both legs.
True, thanks to the hopes of investors for the future growth of the S&P500 and for a positive outcome of the Brexit negotiations, the EUR/USD pair still continued its movement northward, adding about 140 points in a week. As for the final chord, it sounded at the height of 1.2250;

- GBP/USD. With the weakening USD and hopes that the Brexit talks will succeed at the last moment, the pair continues to push higher. At the week's high, December 17, it reached 1.3625, showing a gain of as much as 400 points. However, then a correction followed, and it completed the five-day period just below the level of 1.3500.
Belief in the deal is fueled by media reports that the fishing problem in British waters remains the last hurdle. The markets were encouraged by the statements of the head of the European Commission, Ursula von der Leyen, who said that there is a "narrow path" to the agreement, as well as European Commissioner for Internal Trade Michel Barnier, who confirmed that "the possibility of a trade agreement remains."
Britain also seems to agree to the deal, but, as it was stated, "not at the cost of sovereignty, and control should include the sea as well." Prime Minister Boris Johnson has threatened to keep European fishermen out of British waters for at least eight years if his three years quota fishing proposal is not accepted.
In general, Hamlet's question “To be or not to be?”, which has been sounding for 420 years, as applied to Brexit, is still open;

- USD/JPY. The yen is stable, US Treasuries remain in the same trading range, the dollar is weakening, the USD (DXY) index is falling. All this allows the USD/JPY pair to continue its smooth descent within the downstream medium-term channel, which began at the end of last March. On Thursday December 17, it reached the midline of this channel, fixing a weekly low at 102.85. The last point in the five-day period was set at 103.30;

- cryptocurrencies. What has been expected from bitcoin for three whole years has come true. It not only renewed the all-time high, not only broke through the $20,000 level, but also soared in a short period from December 12 to 17 from $18,000 to $23,620, adding more than 30%.
If we compare the rallies in December 2017 and December 2020, the main difference between them, according to many experts, is that in the first case, the main driving force was retail investors, but now it is institutional. According to the analytical company Chainalysis, the "population" of bitcoin whales (1000 BTC and more) has been expanded with 302 new wallets since the beginning of the year and peaked at 2274 at the end of last month, and balances at the corresponding addresses increased by 1.4 million BTC during this time.
To be fair, it should be noted that the number of retail users is also growing. The number of bitcoin addresses with a non-zero balance has approached the mark of 33 million, updating the historical maximum, according to the data of the analytical service Glassnode. The number of wallets with a balance of more than 1 BTC is also steadily growing. The indicator has set a new record at 827,105 recently, recovering from a slight recession at the end of September.
Of course, we have written about this many times, the coronavirus pandemic contributed to the popularization of bitcoin. However, it is probably early to talk about the mass acceptance of cryptocurrencies by the population. So, in a survey conducted by Opinium and AltFi among UK residents, only 10% said they bought a cryptocurrency. And although the results of 2020 can be viewed as an undoubted improvement - a year ago the figure was half as much, 5.3% - it is still a very small percentage, which leaves significant potential for growth in the crypto market, the total capitalization of which reached $670 billion on December 17.
It should be noted that despite the fact that BTC/USD quotes have already by far exceeded the high of 2017, the capitalization has not reached its record value of $830 billion, recorded on 07 January 2018. That is, the rise in the value of bitcoin is fueled by significantly smaller amounts of fiat than before, which may indicate the pair is strongly overbought. This is evidenced by the values of the Crypto Fear & Greed Index, which rose again in seven days from 89 to 95 and is very close to the maximum value of 100 points. But while waiting for a correction, one should take into account that the end of the year is now, the Christmas holidays are coming, and the most unexpected things can happen on the thin market - from zero volatility to new spikes to the north;

continued below...
 

Stan NordFX

Active member
Stock Trading Is Now Available on Fix, Pro and Zero Accounts


The line of the brokerage company NordFX trading accounts was supplemented by the new Stocks account last December, intended for transactions involving the shares of the world's largest companies. Due to favorable trading conditions, this account has gained considerable popularity over the past time, and therefore it has been decided to include CFD trading of shares in the list of trading instruments on the Fix, Pro and Zero accounts.

1608025613_Stocks_NEWS_NordFX.jpg

Now the company's clients do not need to open a separate account for these operations, since the trading terms and contract specifications on the Fix, Pro and Zero accounts will be exactly the same as they were on the Stocks account.

Trading on the Stocks account will be discontinued. At the same time, previously opened trade orders remain in effect until the client decides to complete these transactions.
 

Stan NordFX

Active member
- USD/JPY. Due to the rise in risk sentiment, investors have lost interest in such protective assets as the dollar and the yen. As a result, these currencies reached a temporary truce and moved to a sideways trend. However, the pair never went beyond the medium-term channel, along which it has been smoothly sliding south since the end of March. And, giving a forecast for last week, the vast majority of experts (70%), supported by graphical analysis on D1, suggested that the lateral movement with bearish sentiment dominance would be continued.
In general, everything happened like that. The pair continued to move eastward, gradually reducing the amplitude of oscillations to the range of 103.85-104.55 and forming a medium-term “pennant” figure with the main support around 103.65. As for the end of the trading session, the finish was set at 104.00 this time;
 

Stan NordFX

Active member
- GBP/USD. The weakening pound has outpaced the weak dollar. The British currency slid down as the threat of a "hard" Brexit becomes more evident. The latest statements by British Prime Minister Boris Johnson and the head of the European Commission Ursula von der Leyen suggest that there will be no real agreement on the terms of Britain's separation from the EU. Johnson advised his citizens to prepare for a "tough" exit, von der Leyen said about the same.
From the high of Friday 04 December to the low of Friday 11 December, the pound lost more than 400 points! And this despite the fact that the pair did not follow the EUR/USD in the wake, as it was until recently, but began to live a completely independent life. Having reached the local bottom at 1.3135 on Friday December 11 afternoon, it managed to win back about 90 points by the evening, putting the final chord at the level of 1.3225. However, this bounce may well turn out to be just a small correction in the pair's tendency to the south;
 

Stan NordFX

Active member
Forex and Cryptocurrency Forecast for December 14 - 18, 2020


First, a review of last week’s events:

- EUR/USD. As expected, the European Central Bank left its interest rate unchanged, at the same level of 0%. The euro had a chance to somewhat weaken its position against the dollar. However, it missed it due to the ECB's decision to ramp up the volume of the Pandemic Emergency Purchase Programme (PEPP) by another €500bn and a subsequent comment from the head of that bank Christine Lagarde. Actually, there was nothing unexpected in this decision, we predicted such an outcome a week ago. In addition, it definitely fell into the middle of the market participants' forecast of €400-600 billion. But it was precisely this predictability that prevented the EUR/USD pair from turning south.
The hawkish sentiment of Christine Lagarde's statements also supported the European currency. It appears she tried to lower the euro rate by announcing that the ECB is closely monitoring the euro. However, the decision of the regulator not to interfere in the affairs of the foreign exchange markets influenced investors much more than a simple statement about “monitoring the exchange rate”. And the unexpectedly hawkish remark of Ms. Lagarde that if the situation with the Eurozone economy improves enough, it may not be necessary to use all these €500 billion, put the final end to the efforts of the bears to move the pair south.
As a result, having dropped to the level of 1.2060, the pair rushed to the north again, rising to the height of 1.2165, and completed the five-day period in the middle of this range, in the 1.2113 zone, practically in the same place where it started on Monday;
 

Stan NordFX

Active member
Indicators

This is a separate area, the essence of which is a mathematical way of averaging and converting the price into different graphs (rarely tables), allowing to cut off the superfluous and highlight the most important characteristics, and therefore more convenient for analysis and forecasting. This can be work according to given formulas with trading volumes, volatility, speed and acceleration of price changes and, of course, trends.

There are a lot of variations of indicators, and there are both basic, time-tested and custom ones. Basic or standard indicators are usually called those that are included in the trading terminal toolkit by default. There are more than 50 of them in MetaTrader 4. A number of them are based on the aforementioned mathematical models of graphic analysis. Custom indicators can be either completely original developments or a modification of standard ones. There are thousands of them at the moment, and many new ones appear every day, which can be purchased or downloaded for free online and integrated into your personal MT4 terminal.

They are divided by their function and purpose:
  • Trending (Moving Average, ADX, Bollindger Bands);
  • Oscillators (Stochastic, RSI, RVI, MACD);
  • Volumes.

The first huge category serves the trader in order to highlight the trend, its strength and direction, predict changes, cut off noise. The second group shows the overbought and oversold market, giving entry and exit points (for opening and closing trades). Volumes demonstrate the involvement of players and their money supply in the market. This is a kind of way to see what capital is behind the selected movement of an asset. All trading add-ons underlying the indicators are the transformation of mathematical formulas.

Patterns

Patterns are graphic patterns that are often repeated in the market, the appearance of which, according to long-term observations, can lead to one or another price movement. These are patterns of formation of bars or candles , their combinations, which are cyclical and in most cases lead to a pre-known scenario. The concepts of "Japanese candle" and "candle models" on Forex are discussed in a separate article in more detail. Here we note that in practice all models are divided into:
  • Reversal Pattern;
  • Uncertainty Pattern;
  • Trend Continuation Pattern.

Each of them can lead to a specific scenario. However, one should not take any of them as an axiom. The efficiency changes in the conditions of the selected time frame, currency pair and type of trading asset. This is why each pattern is tested before being used in real trading conditions. Popular candlestick patterns: hammer, hanging man, harami, doji, falling star, absorption. Graphic shapes: wedge, rectangle, double top, head and shoulders, cup, flag, pennant.

The Main Purpose of the Study and Use

The mistake of beginners is that they try to absorb as much knowledge, and then use all of it in practice. In fact, it is impossible to do that, because it can lead to a “brain explosion”. Mutually exclusive conditions constantly arise in the market. For example, the trend line indicates a dominant up market, and the candlestick formation indicates an imminent reversal. We see a downward trend on the M30 timeframe, while on H4, it, on the contrary, is pointing upwards, and the oscillator is in a neutral position at the same time. What is the priority?

The main task of technical analysis is to give the conditions on the basis of which you will create a trading strategy.

A trading strategy is a set of rules and conditions that can include the readings of one or several indicators, analysis of patterns, and the construction of your own chart patterns on different time frames. A fundamental analysis of macroeconomic statistics and political events can be added there. And the more of these rules you put into your strategy, the worse it will be... the harder it will be for you to analyze the situation and make trading decisions.

There is this proverb — “All in good fun.” The complication of a trading strategy makes it impossible to apply it, even if you create a trading robot instead of your own brain and use all the capabilities of your computer.

A trading robot or a trading advisor is a computer program that will automatically implement the trading strategy embedded in it according to a given algorithm. The advantages are obvious: the program trades 24 hours a day, seven days a week, does not give in to panic or the excitement inherent in humans, and operates within a strictly specified algorithm. There are tens of thousands of trading advisors for MT4 . And now it is easier to buy a ready-made or even download one for free on the Internet than to invent your own with the help of a programmer. Most of the ideas that come to mind for a novice trader have long been implemented. However, keep in mind that an expensive advisor is not necessarily a good one, and a free one is not necessarily a bad one. Quite often the opposite is true.

How to Learn to Make money

The best way to learn is to use good literature. The main condition is to read the books of real traders. We can recommend the following fundamental textbooks among the huge number of repetitive editions:
  • Jack Schwager “Technical Analysis. Full course”;
  • Thomas DeMark "Technical Analysis - The New Science";
  • Steve Nison “Japanese Candles: A Graphic Analysis of Financial Markets.”

Also note that the broker NordFX has created a special section "Education" on its website, where you can gather a lot of information necessary for both beginners and experienced traders. All this useful knowledge is presented not only in the form of dozens of books and articles, but also in the video format.

To consolidate your knowledge, you should definitely go from a theoretical plane to a practical one. The demo account NordFX will help you with this, on which you can, absolutely risk-free, gain real experience trading virtual money.


#eurusd #gbpusd #usdjpy #btcusd #ethusd #ltcusd #xrpusd #forex #forex_example #signals #forex #cryptocurrencies #bitcoin #stock_market
 

Stan NordFX

Active member
Forex PAMM Service


It is possible to make money on currency fluctuations not only by trading. Forex PAMM services allow even those who have no previous trading experience to profit from changes in prices of foreign currency assets. On the other hand, for a professional trader, the Forex PAMM service is an opportunity to increase the size of their trading capital.

What is a PAMM account

PAMM account (from English PAMM - Percent Allocation Management Module) is a special investment account connected to the account of the managing trader. The essence of its work is simple. The trader makes an offer (offer of cooperation with clearly defined conditions), and investors contribute their funds to such an account. As a result of the trading conducted by the managing trader, the profits obtained are distributed among these parties in the proportion specified in the offer.

Key participants in PAMM services

There are three main parties involved in investing in PAMM services:
1. Managing trader. This is a broker's client who has a certain trading experience, confirmed by statistics.
2. Investor. A person who invests their funds into the account of a managing trader. Profits from the results of managing trader's work.
3. PAMM service. This is a broker, for example, NordFX, where trading and financial settlements between the manager and the investor are carried out.

It should be noted that one investor can simultaneously distribute their funds among several managers, forming an optimal investment portfolio, and one manager can accept funds from several investors at the same time.

PAMM services from a manager's point of view

Any trader can become a manager. To do this, you need to register with a broker, for example, NordFX, open a PAMM account, create an offer that will reflect the trader's commission, top up the account and start trading.

By and large, the activities of a manager are not much different from standard trading, but there is one exception. All trader's results will be recorded and displayed for all to see in the form of detailed statistics. It is necessary so that investors can assess the potential of the manager and decide how well the manager's trading strategies are suitable for the investment.

In the NordFX brokerage company, investors can evaluate a manager's trading by almost 50 different parameters that allow them to predict not only potential profit, but also possible risks.

The managing trader will receive their share of the profit based on the results of their work. The rest will be distributed among all investors in the proportion specified in the offer. Moreover, all this is closely watched by the broker who provided the platform for the PAMM service, so that the trader does not have to calculate anything manually. There are no risks of conflict between the manager and investors due to miscalculations either.

What is the main advantage of a PAMM account from the manager's point of view? First of all, this is an opportunity to significantly increase your income from trading on the international Forex market. In addition to their own funds, the manager will work with investors' money and receive a percentage of the profit for this. The better the trading results, the higher the profit, the more investors will invest their funds in this manager.

As for the flaws, there are none. The manager conducts their usual trading, risks their own funds as usual and does not bear any additional responsibility to investors for the results of trading. If successful, the number of investors who want to join the trader will grow. However, if the manager is trading at a loss, there will be no people willing to join their account.

PAMM accounts from an investor's point of view

Not only those who trade on their own, but also those who, for some reason, cannot engage in trading, can make money on the international Forex market. For example, you can't make money, you don't have talent, you don't want to study, you don't have time, and so on. But even in these cases, not all is lost.

The fact is that Forex offers almost limitless opportunities for earning money. It is one of the most liquid markets, with a daily turnover of trillions of US dollars, and many traders are keen to work in it. There is no supply of real assets here, and a trader can conclude a sell transaction with numerous financial instruments, even without possessing them.

For an investor, the Forex market is an opportunity to generate passive income by investing their funds in successful managers. Although this type of work cannot be called completely passive. The fact is that the investor will have to perform a certain amount of analytical work. But it will be connected not with how to predict market fluctuations in currencies, but with how to correctly choose a trader who will be entrusted with managing investor's funds.

What are the main advantages of investing in PAMM?

There are several of them:
1. Investing in Forex through PAMM is very convenient. You, as an investor, only need to choose a suitable manager and connect to their account.
2. Full automation. You don't have to deal with any calculations and settlements. The whole process is fully automated on the broker platform.
3. Control by the broker. The risks of cheating on the part of the trader are excluded. Everything is controlled by the service that provides PAMM investment services. For example, the manager does not have access to the funds that are on the investment accounts connected to him. He or she does not have the slightest opportunity to steal investors' funds and disappear with them in an unknown direction.
4. Investors are offered a convenient investment format. The trading history and comprehensive multifactorial statistics for all managing traders are available, which allows you to evaluate their trading strategies and make competent and weighted decisions.
5. Investing in Forex using PAMM is possible without knowledge of this market. As a depositor, you do not need to dive into the intricacies of trading. All this knowledge is necessary only for the manager.
6. Possibility to create your own investment portfolio. Forex PAMM accounts make it possible for you to diversify your investments by choosing several traders with different trading styles and ratios of profit and risk.

Choosing a manager or how to create your portfolio

Investing through PAMM can be quite profitable. However, there are moments that require effort from those who are going to engage in such activities. The fact is that Forex PAMM accounts, including those at the NordF X broker, are a variety of managers. And the choice is not only about finding the most acceptable conditions in terms of the offer. As mentioned above, investing in the Forex market requires a thorough analysis of the trader’s statistics.

There are three main types of trading strategies that managers use: aggressive, balanced, conservative.

Aggressive managers usually perform well in terms of profit, which can reach hundreds or thousands of percent. But, accordingly, they have quite high risks and large drawdowns. Such accounts are more likely than others to suffer serious losses and can even lead to a complete loss of capital.

Balanced managers show average income. But the risks are also relatively low. Such PAMM Forex accounts suffer losses much less often than aggressive ones.

Finally, conservative accounts show low income. At the same time, investments in Forex with such managers pose the lowest risks. Such traders usually conduct their trading activities the longest, which is reflected in their history on the “showcase” of the PAMM service.

Which option should one choose?

This is where we come to the need to create an investment portfolio. If you plan to invest using PAMM technologies, investments are not much different from buying stocks or other instruments. Classic portfolios usually include different asset categories, both low and high-risk.

When working with PAMM brokers, such as NordFX, your task is to assemble approximately the same portfolio where risks and potential returns are balanced. That is, you can invest in all the categories of managers described above, from aggressive to conservative. As a result, you will be able to get a fairly high profit with limited risks.

In terms of percentage, there are many guidelines. Some experts believe that it would be ideal to allocate only 20% of the total account to aggressive accounts, and divide the rest between balanced and conservative. However, this ratio is not a must. You can determine how aggressive your portfolio will be and make calculations based on it.

Some recommendations for choosing PAMM accounts

And now back to the question of how to choose the most suitable Forex PAMM account. There are several important criteria to pay attention to:
1. Age of the PAMM account. This indicator is particularly important for those investors who plan to invest in aggressive strategies. The longer such managers show positive results, the more reliable they are.
2. Average monthly expected return. This indicator is made up of average monthly profits for previous periods. This way you can see how effective the trader's strategy is and what style of trading they use.
3. Maximum drawdown. This is an equally important indicator that reflects the investor's risks. The higher the maximum drawdown, the more aggressive the trader's style is, and the higher the probability of losing your funds.

Important criteria for evaluation are:
1. The used leverage. Naturally, the higher it is, the greater the load on the deposit, the greater the risks.
2. Limiting risks by the managing trader. If they make up more than 30% of the deposit, the manager either does not use stop orders, or shifts or deletes them in the expectation of a price reversal.
3. The use of various aggressive wealth management systems. The most famous in this case is the Martingale, which is described in numerous textbooks and articles on Forex. Some managers indicate the use of this approach in their offers. But even if this is not the case, it is possible to understand that the manager applies a similar method by loading the deposit and increasing losses during periods of long recoilless trends in traded currency pairs.

When planning to invest in a PAMM service, it is necessary to take into account the ratio of risk and return. This applies to a greater extent to those who will compose their own investment portfolios of managers. Many experts say that the profitability should always be 2-3 times higher than the risk. If the profitability is equal to the risk, you may face such a situation when after a certain period of time, your total profit will be equal to ... 0.

When working with PAMM services, it is very important to establish in advance the conditions for exit, that is, the completion of work with one or another manager (at least temporarily). Various criteria can be used for this, including:
1. Exceeding the maximum drawdown. This is one of the important indicators of risk that you should focus on. It says that the trader has started to work even more aggressively and there are chances of receiving serious losses.
2. Change of the manager's trading system. This is not exactly a reason to part with the manager. Rather, it is a reason for analyzing and re-evaluating the terms of this cooperation and the volume of investments. Perhaps the trader's trading system has become more flexible and efficient than in the original version. In this case, the manager can not only remain in the portfolio, but also get a larger share of investments. However, if irrational, from your point of view, changes have been made to the system, it's time to think about stopping such cooperation.


#eurusd #gbpusd #usdjpy #btcusd #ethusd #ltcusd #xrpusd #forex #forex_example #signals #cryptocurrencies #bitcoin #stock_market

Forex | Forex Trading - NordFX
 

Stan NordFX

Active member
Forex and Cryptocurrency Forecast for May 03 - 07, 2021


First, a review of last week’s events:

- EUR/USD. The last week of April was marked by three events¬: the Fed meeting, as well as the publication of data on the US and Eurozone GDP.
As for the US Fed, the results of its meeting were predictable. The interest rate was left unchanged at 0.25%. The volume of the quantitative easing program (QE) remained the same, $120 billion monthly. And the head of the regulator Jerome Powell uttered almost word for word what we wrote in the previous forecast: although the pace of the US economic recovery is impressive, this is completely insufficient to talk about curtailing fiscal stimulus programs. So far, everything is rather fragile, the acceleration of inflation, according to Powell, is a temporary factor, and the number of people employed remains 8.5 million lower than in February 2020.
On the other hand, US GDP growth in the first quarter was higher than forecast and amounted to 6.4% (against 4.3% a quarter earlier), showing the best dynamics since 1984. The country's economy needs to add just 1% to reach the pre-crisis high. And, most likely, it will fully recover even before the beginning of July by to this indicator.
Such strong statistics led to an increase in the yield of US Treasuries. But this did not help the dollar much until the end of the week, since European bonds were also growing. Germany's 10-year debt rates have hit their highest since March 2020.
The gap between the US and the EU in terms of the speed of return to pre-crisis indicators may also soon be narrowed. ECB President Christine Lagarde said on April 28 that "a light is already visible at the end of the tunnel as the pace of vaccination in the EU accelerates" and that economic recovery is expected to accelerate in the second half of the year.
As a result of the above, the fight between the bulls and the bears on EUR/USD has been going on with varying success all week. Strong inflationary expectations continue to weigh on the dollar. President Joe Biden continues to flood the economy with colossal amounts of money. Following the $1.9 trillion stimulus already approved by Congress, $2.25 trillion in infrastructure development and $1.8 trillion in social support are awaiting their turn. As a result of such steps by the US administration, the dollar went down and the EUR/USD pair renewed its two-month high on Thursday, April 29, reaching 1.2150.
However, thanks to not the most impressive macro statistics from the EU, the European currency nevertheless lost ground on Friday. An additional impetus to the dollar was given by the auction for the placement of treasury bonds on Friday evening, April 30. The US Treasury Department sold $130.6 billion worth of debt securities there. This withdrawal of liquidity from the financial system provided additional support to the American currency. As a result, the pair completed the five-day period significantly below the start of the week, at the level of 1.2020;

- GBP/USD. When providing last week's forecast for the pair, 45% of experts voted for its move north, 35% to the south and the remaining 20% to the east.
As expected by most of them (45%), the pound was strengthening its positions the first four days, and investors started to hope that the GBP/USD pair would break through the 1.4000 level again and return to steady growth, as it had been since the end of March 2020 until the end of February 2021 However, having reached 1.3975, its movement stalled, the bearish pressure intensified, and it collapsed downward at the very end of the week, as 35% of analysts had expected. Pushed by the results of the auction held by the US Treasury, the pair reached the local bottom at the 1.3800 horizon. This was followed by a couple of small bounces and a finish at 1.3810, which can be considered the Pivot Point of the last 9 weeks. So, those 20% of experts who voted for the sideways trend of the pair were also satisfied;

- USD/JPY. It has already been said that the yield on US government bonds has been the key indicator for this pair. It was growing over the past week. The dollar grew along with it against the yen. As a result, the USD/JPY pair rose above the level of 109.00 and, having added 145 points, completed the trading session at 109.30;

- cryptocurrencies. When making a forecast seven days ago, we wrote that the main task of the bulls last week would be to keep the BTC/USD pair in the $ 50,000 area. And, they succeeded, though with difficulty. Despite the fact that the quotes fell to $47,000 on April 25, they managed to rise again to the $50,000-55,000 zone. Investors and speculators began to actively acquire coins at the bottom, counting on further profits. And if the total capitalization of the crypto market was at the level of $1.750 trillion on April 26, it had already reached $2.110 trillion on the last day of the month.
Although not much, the news background helped the bulls. So, the news portal Coin Desk reported that the American financial giant JPMorgan had finally decided to launch a fund focused on BTC. Reporters found out that this bitcoin fund will start operating this summer.
The launch of Bitcoin-ETF could serve as another support factor. However, the US Securities and Exchange Commission (SEC) postponed its decision on the VanEck application until June. At the moment, a total of 10 applications for launching ETFs have been submitted, and the regulator decided that it needs more time to study them.
So, the main cryptocurrency stayed in the area around $50,000. But it was never able to rise above the 50-day moving average, which has served as sustained support for the BTC/USD pair since October 2020. As the quotes approach this line, which has now become resistance, the activity of buyers begins to fall sharply. And this is a rather alarming sign for investors: the market is in thought, which is confirmed by the Crypto Fear & Greed Index located in the heart of the neutral zone: at the level of 51 points.
We have repeatedly said that in such a situation of uncertainty with the reference cryptocurrency, many investors are turning their attention to altcoins. Bitcoin continues to lose ground. If its share in the total capitalization was 72.65% on January 2, and 50.70% on April 23, then it fell even lower by the end of the month, reaching the level lowest since July 2018: 47.87%.
On the other hand, the attractiveness of Ethereum is constantly growing. CoinMetrics calculates that the hashrate in the Ethereum network has grown by 89% over the past 100 days. And the ETH/USD pair, unlike Bitcoin, continues to update historical highs over and over again, rising to a height of $2,790 on April 29.


As for the forecast for the coming week, summarizing the views of a number of experts, as well as forecasts made on the basis of a variety of methods of technical and graphical analysis, we can say the following:

- EUR/USD. The weakening of the dollar, which has become almost the main safe haven asset during the pandemic, is facilitated by the growth of inflation expectations, which exceeded 2.4% and reached a high since 2013. The huge financial injections should lead to a record growth in US GDP, which, accordingly, entails an increase in risk sentiment and investors' attraction to the stock market. According to Dow Jones Market Data, the S&P500 rose 11% during Joe Biden's first 100 days as President of the United States. This was the best result since President Franklin Roosevelt in 1933, and on average, since 1929, stock indices grew by 3.2% annually.
On the other hand, being the most powerful in the world, the US economy will pull up with it the economies of other countries, leveling the gap in the speed of their recovery. The dollar should also be helped by an increase in yields on US Treasury bonds.
So far, giving a forecast for the coming week, 60% of experts expect that the EUR/USD pair will try to go up again. The nearest resistance is 1.2055 and 1.2100, the target is to reach the April 29 high of 1.2150. 70% of oscillators and 75% of trend indicators on D1 agree with this forecast. The remaining 30% of the oscillators are colored neutral grey.
When moving from a weekly to a monthly forecast, the opinion of experts changes radically. Here, 75% of them are waiting for the dollar to strengthen and the pair to drop to the 1.1900 zone, and then another 100 points lower. The target of the bears is to update the March 31 low of 1.1704.
Graphical analysis on D1 indicates the movement of the pair in the trading range of 1.1945-1.2150. At the same time, according to its readings on H4, the pair first faces a decline to the lower border of this channel, and then a rebound upward.
As for the events of the coming week, one should note the publication of ISM business activity data in manufacturing (May 3) and private (May 5) sectors of the United States. We are also waiting for US employment data: the ADP report will be released on Wednesday May 5, and the number of new jobs created outside the agricultural sector (NFP) will be known on Friday May 7.
The European consumer market is likely to delight investors on May 3 and 6. The fall in retail sales in Germany is forecast to narrow from -9.0% to -3.15%. Retail sales in the Eurozone as a whole may, according to forecasts, grow from -2.9% to + 9.4%;

- GBP/USD. The main event for the British currency will be the meeting of the Bank of England on Thursday, May 6, which will be devoted to monetary policy. The interest rate is most likely to remain unchanged at 0.1%. As for QE, the volume of purchases of government bonds may be reduced from ?895 to 875 billion. If this happens, the market will receive a signal about the intention of the British regulator to start tightening its policy.
The bank may also revise its forecasts regarding the speed of economic recovery in the country. There are many reasons for this. Thus, unemployment in Great Britain decreased by 0.1% in the first quarter, from 5.0% to 4.9%. Almost 30 million people have already been vaccinated in the country, of whom more than 2.5 million received two doses of vaccines against COVID-19. Some of the quarantine restrictions have been removed. And all these are positive factors for the pound, which may push the GBP/USD pair up again. This is confirmed by the forecasts of graphical analysis on H4 and D1.
As for the readings of technical indicators, they look rather indistinct on D1 due to the sideways movement of recent weeks. On H4, naturally, most are painted red, although 25% of oscillators signal the pair is oversold.
As for the experts, 60% expect the pair to grow at least to the level of 1.4000. In case it manages to break through it, the next target is 1.4240. The nearest resistance levels are 1.3860, 1.3925 and 1.3975.
The remaining 40% of analysts side with the bears. The main support is in the zone 1.3670-1.3700, then - 1.3600;

- USD/JPY. The experts' opinion coincides completely with what was expressed a week earlier. 70% of them believe that the pair will go south again, below the horizon at 109.00. The next supports are 108.40 and 107.45. The remaining 30% of analysts expect the pair to continue to rise. Resistance is at 110.00, the target is to rise another 100 pips to 111.00.
As for the indicators, 75% of oscillators and 100% of trend indicators on H4, and, respectively, 70% and 95% on D1 are coloured green. The remaining oscillators signal that the pair is overbought. Graphical analysis on both time frames indicates a fall of the pair to the level of 107.45;

- cryptocurrencies. So, as it was said in the first part of the review, the BTC/USD pair did not manage to break above the 50-day moving average on the last day of April. And this looks like a wake-up call for investors. Especially because the fall below this line happened for the first time since the beginning of October last year, when the pair just broke the $10,000 level.
The Bitcoin Dominance Index also fell below 50%, which, attracting institutions, dragged the entire crypto market up with it like a locomotive.
Taken together, both of these factors, according to a number of analysts, strongly resemble the situation in January 2018, which marked the beginning of a protracted crypto winter.
But, along with pessimists, the voices of optimists are usually heard. Thus, the creator of the stock-to-flow model, a popular cryptocurrency analyst known as PlanB, believes that the current decline in bitcoin is quite normal and expected, and only confirms the bullish trend. The analyst stressed that one should not expect constant growth, sometimes pullbacks should also occur: “Nothing grows without pullbacks. Bitcoin has already been growing for 6 months in a row. This is similar to the mid-cycle correction we saw in 2013 and 2017.”
PlanB noted that he even “calmed down to some extent”: the market was too overheated, and now a small “cooling” phase awaits it. In addition, the rate of the first cryptocurrency turned out to be lower currently than the expectations of the S2F model, which means it may well continue to grow.
Dan Morehead, CEO of venture capital firm Pantera Capital, is also positive. According to the businessman, BTC is doomed to further growth, as more and more investors begin to understand that storing capital in cryptocurrency is much more efficient than in traditional instruments.
According to the calculations by the head of Pantera Capital, the value of BTC adds $200 every time 1 million new users register on its network. If such dynamics persist, the price of cryptocurrency in 2022 will approach or even exceed the $200,000 mark.
According to Dan Morehead, the spread of bitcoin is a result of, among other things, the growth in the number of smartphone users. There are now about 3.5 billion people in the world who own such devices, making bitcoin available anywhere and at any time.
kOwqs9D.jpg


NordFX Analytical Group


Notice: These materials should not be deemed a recommendation for investment or guidance for working on financial markets: they are for informative purposes only. Trading on financial markets is risky and can lead to a loss of money deposited.

#eurusd #gbpusd #usdjpy #btcusd #ethusd #ltcusd #xrpusd #forex #forex_example #signals #cryptocurrencies #bitcoin #stock_market

Forex | Forex Trading - NordFX
 

Stan NordFX

Active member
Super Lottery: NordFX Gives Away 100,000 USD to Traders


Fac6FKT.jpg


The $100,000 Super Lottery was launched by the brokerage company NordFX among its clients on April 1. The name speaks for itself: 100 cash prizes of $500, $1,000, $2,500 and a super prize of $ 20,000 will be drawn by the year end.

It is quite easy to take part in the lottery and get a chance to win one or even several of these prizes. It is enough to have a Pro account in NordFX (and for those who do not have it - register and open a new one), top it up with $200 and... just trade.

Having made a trading turnover of only 2 lots in Forex currency pairs or gold (or 4 lots in silver), the trader will automatically receive a virtual lottery ticket. The number of lottery tickets for one participant is not limited. The more deposits and the greater the turnover, the more lottery tickets the participant will have, and the greater their chances of becoming a winner of the prize money.

Unlike trader contests, there is no need for a lottery participant to show exceptional trading results. In this case, both experienced professionals and beginners have equal chances of winning. And they can either use the received prize money in further trading, or take it out without any restrictions.

70 prizes of $500 each, 20 prizes of $1,000 each, 10 prizes of $2,500 and 1 super prize of $20,000 will be drawn. The draws will be held on July 1, October 1, 2021 and January 3, 2022.


Notice: These materials are not investment recommendations or guidelines for working in financial markets and are intended for informational purposes only. Trading in financial markets is risky and can result in a complete loss of deposited funds.


#eurusd #gbpusd #usdjpy #btcusd #ethusd #ltcusd #xrpusd #forex #forex_example #signals #cryptocurrencies #bitcoin #stock_market

Forex | Forex Trading - NordFX
 

Stan NordFX

Active member
Forex Forecast and Cryptocurrencies Forecast for April 26 - 30, 2021


First, a review of last week’s events:

- EUR/USD. The US economy is showing impressive growth. Europe, on the other hand, is in a widespread lockdown and, apparently, is experiencing a second recession. The share of those who received at least one COVID-19 vaccine in the EU is 25.1%, while in the United States there are 2.5 times more of them, 63.2%. Can the euro grow in such a situation? Only 25% of experts answered positively to this question last week, and they turned out to be right: the pairEUR / USD reached the level of 1.2080 on Tuesday, April 20.
The majority of analysts (50%) believed that the bulls and the bears would be engaged in “tug of war” across the 1.2000 line. And they also turned out to be not far from the truth: the pair fluctuated up/down in the range of 1.1995-1.2080 from Tuesday until the end of the week. Although, of course, the victory remained with the bulls, since the last chord of the trading session sounded near the high of the last seven weeks at 1.2100.
There are two main reasons for these dynamics. The first one is in America, the second one is on the other side of the Atlantic, in Europe.
On the one hand, the yield on long-term US Treasury bonds continues to fall, and along with it the US currency continues to weaken. The dollar index against a basket of six major currencies (DXY) declined to 91.0, down 230 points from this year's high of 93.3. This fuels the risk sentiment of investors and continues to push the major US stock indexes up. This happens even despite the proposal of US President Joe Biden to almost double (from 20% to 39.6%) the capital gains tax for citizens with income of $1 million or more.
On the other hand, the euro was supported by positive forecasts for the rate of vaccination in Europe, in particular the news that Pfizer will increase the supply of vaccines to the EU by 100 million doses. The yield on German bonds is growing, which are beginning to catch up with their competitors from the United States. Stronger than expected statistics on business activity in the Eurozone helped the bulls on EUR/USD as well. Analysts polled by Reuters expected on average the PMI to decline from 53.2 points to 52.8. However, it rose to 53.7 in April;

- GBP/USD. First, a few words about another pair, GBC/USD, which may appear in the foreseeable future. While in some countries, regulators ban cryptocurrencies (for example, in Turkey), in others they are trying to put them at their service. The Bank for International Settlements (BIS) has recently conducted a survey and it has turned out that of 66 central banks, 52 are thinking about their own digital currency. And one of these reflective regulators is the Bank of England, backed by one of the country's largest financial conglomerates, Barclays.
The digital pound has already received a playful name "Britcoin", which makes those who know what "Brit Milah" smile. For those who are not in the know, let us explain: this is a rite of circumcision among religious Jews. However, if Brit Milah is rooted in the deep past, then Britcoin is the digital future of the UK that has broken away from the EU.
But until the GBC/USD pair has appeared in the list of trading instruments, let us return to its “older sister”, the GBP/USD pair. It went up at the beginning of the week, thanks to the weakening dollar, like EUR/USD. The pair reached a height of 1.4010 on Tuesday, having added 170 points. However, it did not manage to fix above the 1.4000 horizon: the pound lost all its advantage two days later, and the pair dropped to the level of 1.3825. At the very end of the trading week, the pound was helped by strong statistics on business activity in the services sector: the Markit index rose from 56.3 to 60.1 (against the forecast of 59.0) over the month, thanks to which the pair grew slightly and completed the five-day period at 1.3885;

- USD/JPY. Recall that we talked in the previous review about the fact that one of the reasons for the fall in the yield of 10-year US Treasury bonds, and with it the strengthening of the yen against the dollar, may be the return of Japanese buyers to the market. They were actively getting rid of American bonds at the end of the financial year, but they began to replenish their investment portfolios with them now.
The majority of analysts (70%) voted seven days ago for the fact that the growth of the Japanese currency and the decline of the USD/JPY pair will continue, and this forecast turned out to be absolutely correct. The level 107.50 was indicated as a support, which became the local bottom of the week. This was followed by a correction and a finish at 107.85;

- cryptocurrencies. While the task of the bulls on Friday, April 16 was to prevent the BTC/USD pair from falling below $60,000, they are struggling seven days later to gain a foothold in the $50,000 area. After the explosive growth to $64,800, which took place on the eve of the American exchange Coinbase' IPO, we are witnessing an equally rapid collapse now. The price of bitcoin was falling to the level of $47,545 on Friday April 23, showing a 26.6% drop.
It is difficult to single out any one reason for what happened. Prominent analyst Willy Woo said the drawdown was triggered by massive power outages in Xinjiang province, one of the largest regions in China where bitcoin mining is concentrated. According to the BTC Cambridge Energy Consumption Index, Xinjiang accounts for about 25% of the coin's total hashrate. Due to the fact that most of the miners were temporarily out of order, the hash rate of the asset began to decline, and the average transaction fee on the bitcoin network exceeded $50, which has not been the case since 2017.
According to Woo, bitcoin should have returned to growth after the electricity supply situation stabilized. Electricity returned to Xinjiang, but bitcoin continued its decline.
We have repeatedly written that the crypto market is heavily influenced by regulatory risks. And in this case, it is possible that panic has been fueled by the rumors that an investigation may begin in the United States regarding a number of financial institutions on suspicion of money laundering using cryptocurrencies. Additional pressure on the market was made by two news stories. The first is the news that the US Congress has approved the creation of a SEC and CFTC working group to develop cryptocurrency regulation. The second is the plans of US President Joe Biden to raise taxes on capital gains, which could limit investment in digital assets.
The total cryptocurrency market capitalization decreased by 17% over the week, from $2.2 trillion to $1.825 trillion. Meanwhile, bitcoin continues to lose ground. If its share in the total capitalization on January 2 was 72.65%, then it is only 50.70% on April 23. This suggests that investors are looking for more profitable assets for their investments among altcoins, of which there are currently more than 8,000. Just look at the Ethereum quotes. Despite the April 18 crash, this leading altcoin managed to renew its all-time high last week, reaching $2,635. Of course, a wave of sales did not pass it, but the fall in the price of ETH over the week was only about 11%. As for the participation of Ethereum in the total capitalization of the crypto market, its share has grown from 10.79% to 14.49% since the year started.
Summing up the past week, we note that the bitcoin price dropped below the 50-day average, which is quite an alarming factor and may provoke further sales. The BTC dominance index, as already mentioned, is also going down. However, it is still far from the lows of early 2018, when it fell to 32%. Another index, Crypto Fear & Greed Index, dropped from 78 to 55 points during the week and approached the neutral zone.


As for the forecast for the coming week, summarizing the views of a number of experts, as well as forecasts made on the basis of a variety of methods of technical and graphical analysis, we can say the following:

- EUR/USD. As expected, the European Central Bank
maintained an ultra-soft policy and did not make any adjustments at its meeting on April 22. And its head Christine Lagarde made every effort to limit further growth of the euro. Investors should have concluded from her speech that the ECB will begin to roll back fiscal stimulus (QE) later than the US Federal Reserve, since the EU economy lags behind the American one. (According to JPMorgan forecasts, the GDP of the Eurozone, after a 1% decline in the first quarter of 2021, is expected to grow by 6% in the second quarter. In the US, the same figures are +5% and +10%).
The ECB is not interested in a strong euro, as it interferes with European exports, and considers the current EUR/USD quotes to be quite high. However, Ms. Lagarde was unable to reverse the pair's downward trend. Moreover, it is very likely that the US Federal Reserve Head Jerome Powell will say the same thing at its upcoming meeting on Wednesday, April 28 as she did: that, although the pace of the US economic recovery is impressive, this is absolutely not enough to start discussing curtailment of fiscal stimulus programs.
The next meeting of the ECB will be held on June 10, and a lot can happen during this time. The euro will be pushed upwards by the increasing rate of vaccination and the economic recovery of the EU. And the bears are unlikely to be able to turn the pair south until the yield on US Treasuries starts to rise again.
Goldman Sachs analysts believe that the four largest countries in the Eurozone will vaccinate 37% of their population by the end of May, and this figure will already be 54% by the end of June. As a result, the bank raised its forecast for EUR/USD from $1.2100 by the end of the year to $1.2500.
The latest Bloomberg consensus estimate, on the contrary, decreased. If the figure called in January was 1.2500, now it is 1.2200. Although this value suggests further strengthening of the euro.
The main event of the coming week will be the meeting of the Open Market Committee of the US Federal Reserve System and the commentary of its management on the future monetary policy. Jerome Powell, as already mentioned, is likely to adhere to a rhetoric similar to Christine Lagarde, which may put another pressure on the yield of American bonds and the USD rate.
Growth of the euro in the coming week is expected by 60% of experts, supported by graphical analysis, 100% of trend indicators and 85% of oscillators onH4 and D1. The remaining 15% of the oscillators give signals that the pair is overbought. Resistance levels are 1.2125, 1.2185, the target is the February 25 high at 1.2245.
It should be noted that when switching to the forecast for May, the picture changes sharply, and here it is already 70% of experts, supported by graphical analysis on D1, who expect the EUR/USD pair to fall below the 1.2000 horizon. Supports are located at 1.1940, 1.1865 and 1.1800 levels. The target of the bears is the low of the end of March around 1.1700.
As for the events of the coming week, apart from the Fed meeting, one should pay attention to the statistics on consumer markets: the USA - on Monday April 26, Germany - on Thursday April 29 and the Eurozone¬ - Friday April 30. In addition, GDP indicators for the first quarter will become known: the USA - April 29, as well as Germany and the Eurozone - April 30;

- GBP/USD. A number of experts believe that successful vaccination of the population will help warm up the UK economy. Quarantine restrictions have been severely relaxed in recent weeks, pubs and restaurants have opened. Macro statistics are encouraging. However, Brexit-related concerns, massive trade deficits and UK budget deficits continue to weigh on the pound. But the dollar is also under pressure. Perhaps that is why the forecast for the GBP/USD pair looks rather contradictory: 45% of experts vote for its movement to the north, 35% to the south and the remaining 20% to the east. The technical analysis readings on H4 look contradictory as well.
On D1, thanks to the uptrend that began 13 months ago, most of the oscillators (65%) and trend indicators (85%) look up. Graphical analysis also indicates that the pair will try again to storm the 1.40000 high, but after that it will go down to the support in the 1.3670-1.3700 zone. The nearest resistance level is 1.3920, the nearest support is 1.3800;

- USD/JPY. The key indicator for this pair was and is the yield on US government bonds. If it continues to decline next week, then the pair USD/JPY will go further down. The nearest support is in the 106.80-107.10 zone, the next one is located near the 200-day moving average of 105.80.
The experts' opinion coincides completely with what was expressed a week earlier. 70% of them believe that the pair will continue to fall. The remaining 30% expect the pair to rebound upward (resistance levels 108.35 and 109.00). There is complete discord among the oscillators on H4, on D1 - 75% are colored red, and 25% give signals that the pair is oversold. Graphical analysis on both time frames shows that at first the pair can rise to the resistance of 108.35, and only then, having bounced off this level, it will sharply go down;
RiTAMUQ.jpg

- cryptocurrencies. According to a number of experts, the drop in the share of bitcoin in the total capitalization of the crypto market is a very alarming factor for investors. Recall that the dominance index of the leading cryptocurrency was 85% at the beginning of 2017, and it decreased to 45% before the collapse. Now this figure is just over 50%. Pessimists argue that the rise in BTC/USD quotes before the listing of Coinbase on the NASDAQ exchange was the last stage of the bullish rally, and we need to prepare for a new "crypto winter" now, which could stretch for several years. This is confirmed by the massive liquidation of BTC futures.
However, as is usually the case, in addition to pessimists, there are also optimists. For example, analysts at Santiment believe that bitcoin's trend remains bullish. They have reached this conclusion having analyzed the frequency of tweets with the phrase "buy the dip" and "bought the dip". With the bitcoin price dipping below $51,000, the number of low buy posts hit a weekly record of 2,108 tweets. This allowed Santiment analysts to conclude that this correction is nothing more than a "bump in the road."
However, two thousand Twitter users are unlikely to seriously affect the market. Much more important is the mood of institutional investors who are not crypto enthusiasts at all. And there is a high probability that they will not be active until there is clarity on the attitude of the leading regulators to the sector. Those of the "whales" who purchased the cryptocurrency in the fall of 2020 may well start fixing profits at the current level: the price around $45,000-50,000 is more than acceptable for them. But new large purchases look quite risky.


NordFX Analytical Group


Notice: These materials should not be deemed a recommendation for investment or guidance for working on financial markets: they are for informative purposes only. Trading on financial markets is risky and can lead to a loss of money deposited.

#eurusd #gbpusd #usdjpy #btcusd #ethusd #ltcusd #xrpusd #forex #forex_example #signals #cryptocurrencies #bitcoin #stock_market

Forex | Forex Trading - NordFX
 

benworkjohn

New member
Hello ,
you write a lot about forex and I would be happy to earn as much as you write.
I gave up forex after 5 years in which I learned to make robots (expert advisor) in mql4 for mt4 and I won some competitions. There is a big difference between a demo account and a real one.
In demo accounts, EA works and in real accounts they are blocked by very many users. Very few users can use EA in real accounts and the lines of code are respected. This problem has been encountered by several programmers and traders. When asked who creates these problems, I don't have a sure answer for a hacker or a broker.
Many of your strategies posted here on the tester give negative results over a long period of time.
 

Stan NordFX

Active member
Forex Forecast and Cryptocurrencies Forecast for April 19 - 23, 2021


First, a review of last week’s events:

- EUR/USD. The past week was marked by two important economic events: impressively strong macro-statistics from the USA and a collapse in the yield of 10-year US government bonds.
According to the data published on Thursday April 15, US retail sales jumped by +9.8% in March (against the forecast +5.9% and a fall of -2.7% in February), which is the best indicator for the last 10 months. What is happening on the labor market also shows an active recovery of the country's economy. Thus, the number of initial applications for unemployment benefits fell from 769 thousand to 576 thousand. And this is not just better than the predicted 700 thousand, this is the lowest level since the beginning of the COVID-19 pandemic. Industrial production grew by 2.7%.
All these figures clearly indicate the rapid growth of US GDP in the first quarter of 2021. and allow us to speak with confidence about its continuation in the coming months. Against this background, the collapse in the yield of American Treasuries, the strongest since the beginning of last November, looks surprising. If at the end of March, the yield on 10-year bonds reached a local multi-month maximum of 1.775%, now it has fallen to 1.583%.
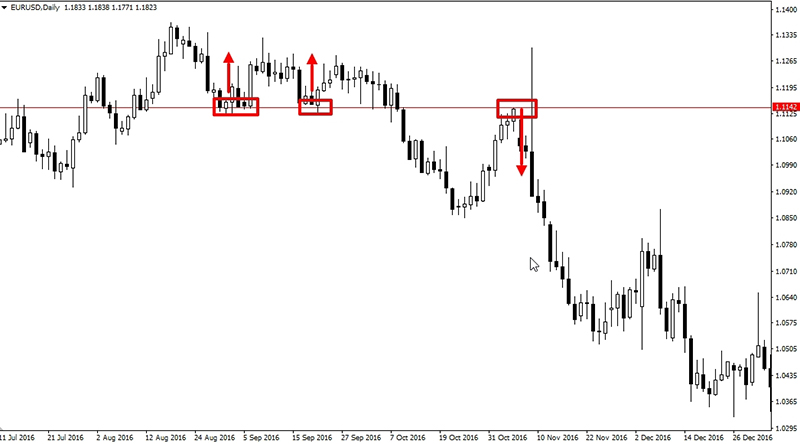
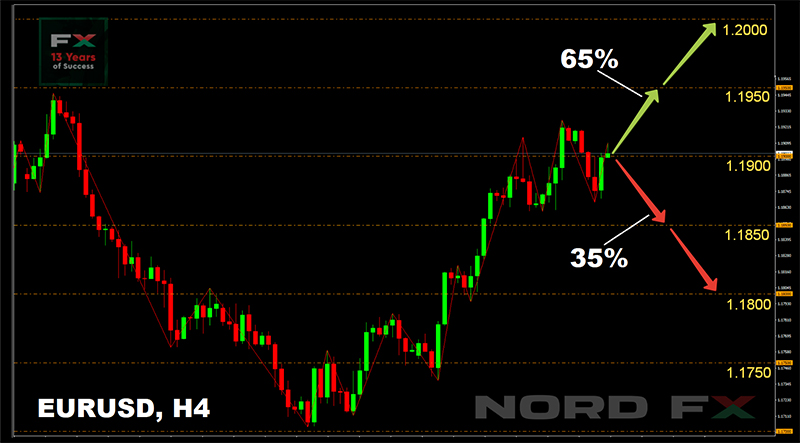
Along with bonds, the dollar is weakening. The USD DXY index is trading in the 91.5 zone on Friday, April 16, which is 180 points below this year's high of 93.3. As a result, as predicted by most experts (65%), the EUR/USD pair continued its growth last week, coming close to the important support/resistance level of 1.2000 and ending the five-day period at 1.1980.
This situation suggests that strong economic statistics from the United States can no longer provide serious support to the US currency. And the latter is now more correlated with the yield on Treasury bonds. Apparently, the rate of vaccination against coronavirus has already been taken into account in the USD quotes. And new fiscal stimulus programs and endless printing of new money by the Federal Reserve started working against the dollar. Its weakening has already gone beyond the usual correction, heating up the risk sentiments of investors: in addition to the euro, the currencies of commodity and developing countries are also growing, and the S&P500 index renews its all-time high for the 22nd time this year;

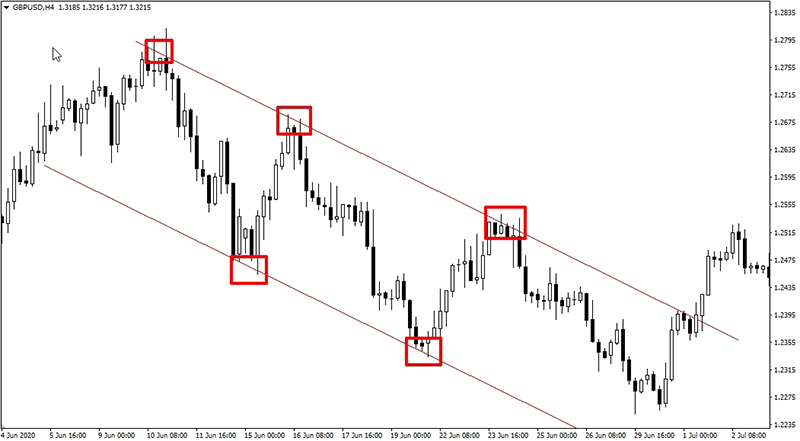
- GBP/USD. The weakening dollar supported the British currency, the fall of the GBP/USD pair stopped, and it even managed to climb 120 points. Thus, its movement over the past four weeks can be defined as lateralin channel 1.3670-1.3920. As for the last chord, the pair placed it in the central zone of this channel, ending the trading session at 1.3840;

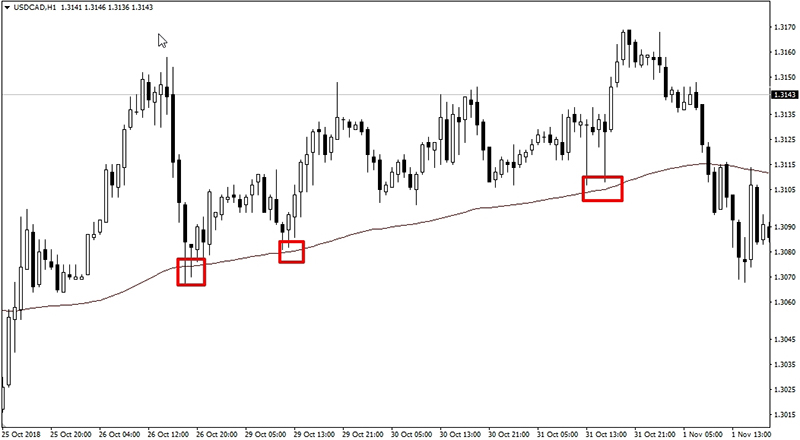
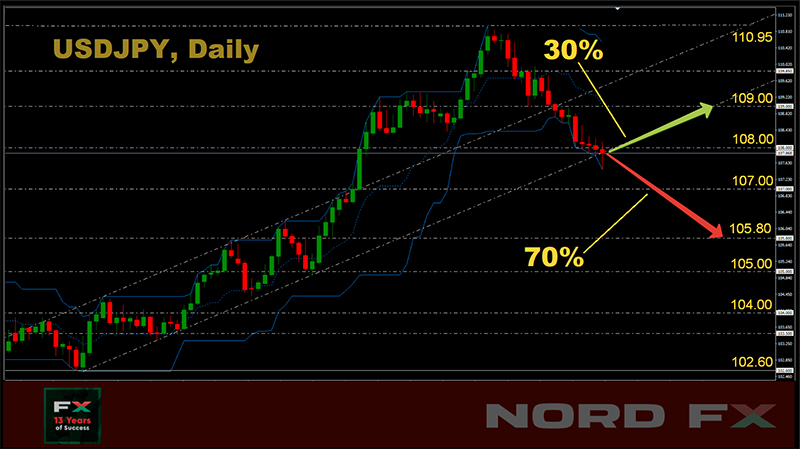
- USD/JPY. It was said above about a sharp drop in the yield on 10-year US Treasury bonds. Experts call the coverage of short positions by hedge funds, as well as the return of Japanese buyers to the market, among the possible reasons for this collapse. They were actively getting rid of American bonds at the end of the financial year, but they began to replenish their investment portfolios with them now. This led to an increase in demand for the yen, which, thanks to the negative interest rate, they use to finance such operations.
One of the scenarios pronounced a week ago suggested that the weakening of the dollar and the strengthening of the yen would push the pair USD/JPY towards the support of 108.40. This is exactly what happened: starting from the level of 109.65, the pair dropped to the horizon 108.60 by Thursday, April 15, followed by a small rebound and a finish at 108.80;

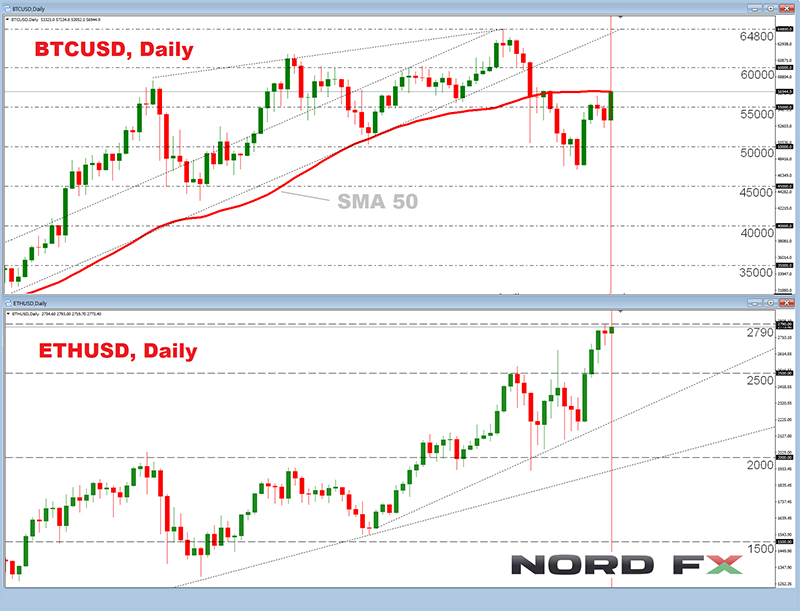
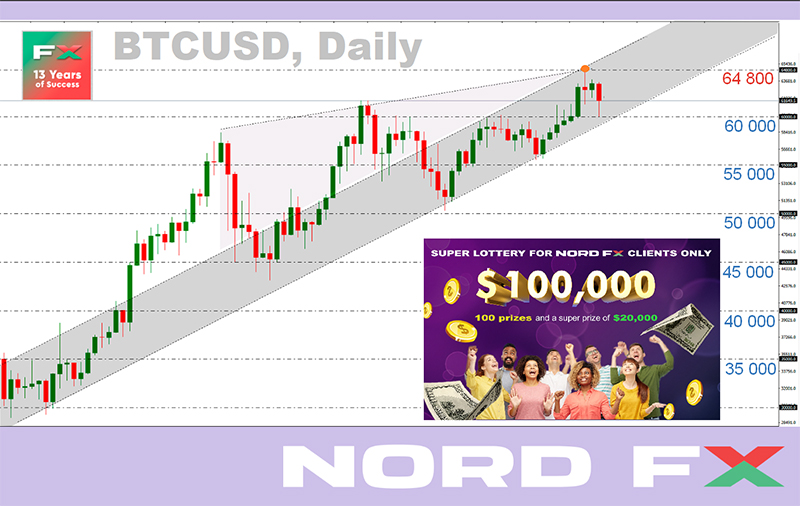
- cryptocurrencies. What has been so much anticipated over the past eight weeks has come true: Bitcoin has finally broken through the $60,000 horizon and is now trying to gain a foothold above this important psychological level. The new historical high was the height of $64,800, which the BTC/USD pair reached on Wednesday April 14. However, a correction followed, and the bulls were struggling to prevent the main cryptocurrency from falling below $60,000 for the whole of Friday, April 16.
According to the Forbes rating, thanks to the growth of bitcoin, its creator under the pseudonym Satoshi Nakamoto got into the top 20 richest people in the world. According to various estimates, he owns between 750k and 1.1 million BTC coins, and his fortune has exceeded $60 billion now.
But if Nakamoto became the owner of countless crypto-treasures a long time ago, then the current large investors are only at the beginning of their journey. According to the analytical service Santiment, the so-called "whales" continue to accumulate bitcoins. Analysts found that they have accumulated up to 2.2% of the total cryptocurrency market supply so far, reaching an 11-month high. A similar situation was observed at the beginning of May last year. As the Santiment report says, we are talking about investors controlling 100,000 or more BTC.
Along with the "whales", for the first time since December 2020, miners have also started to accumulate savings, which creates a shortage of supply and contributes to an increase in the price of the main digital asset.
Miners receive income in cryptocurrency, but they pay fiat to service and equipment providers, so they are forced to sell part of the mined coins. The volumes of such sales depend on current market conditions and expectations of the bitcoin price. Starting from March 31, miners started accumulating BTC reserves again. Whereas for four months before that, they reduced their positions, converting bitcoins to fiat. The largest volumes of cryptocurrency, from 17,000 to 24,000 BTC per day, were sold by them in January 2021.
“Miners have switched to accumulating digital assets, because they have enough cash reserves to support their activities, which they raised during the rise of bitcoin from $20,000 to $40,000. Or, most of them are holding coins in anticipation of further appreciation,” Flex Young, CEO of Hong Kong-based Babel Finance, told CoinDesk. The number of bitcoins in miners' wallets has increased to 1.806 million BTC over the past two weeks.
The growth of the BTC/USD pair is facilitated by a weak dollar and a decrease in the yield of long-term US government bonds as well. This increases the attractiveness of cryptocurrency as a hedge against inflation.
The total crypto market capitalization on April 10 finally crossed the $ 2.0 trillion bar, and never fell below it. At the time of this writing, on April 16, it is at $ 2.2 trillion.
At the same time, the share of bitcoin in the total crypto market capitalization continues to decline continuously: if it was 72.65% on January 2, then it was only 52.10% on April 16. As already mentioned, this is most likely due to the fact that speculators are switching to other, more profitable, assets.
As for the Crypto Fear & Greed Index, it rose from 70 to 78 points in a week. Both values are in the overbought zone, but they are still far from critical, and therefore cannot become a serious obstacle to the growth of the BTC/USD pair.


As for the forecast for the coming week, summarizing the views of a number of experts, as well as forecasts made on the basis of a variety of methods of technical and graphical analysis, we can say the following:

- EUR/USD. As mentioned in the first part of the review, trillions of dollars of economic support programs not only increase the US national debt, but also begin to put serious pressure on the American currency. Low, close to zero interest rates do not help it either. But at the same time, the head of the FRS says that although the pace of the US economic recovery is impressive, it is not enough to even begin to discuss the curtailment of fiscal stimulus programs. According to Jerome Powell, this requires several more months of such positive results. The economy must “make even more significant progress” towards target levels of employment and inflation.
Of course, such statements are not good for the dollar and contribute to the growth of risk sentiment. But as for the other side of the Atlantic Ocean, there are more and more vigorous statements of EU officials about the imminent termination of lockdowns and the unprecedented growth of the Eurozone economy. According to the consensus forecast of Bloomberg experts, the ECB will slow down the emergency asset purchase (QE) program by July, and at the end of this year will announce its termination in March 2022.
All of the above could lead to the EUR/USD breakout of the 1.2000 resistance and its rise to the January highs in the 1.2300 area. Resistances on this path will be the levels 1.2125 and 1.2185.
However, at the moment such a bullish forecast is supported by only 25% of experts. True, graphical analysis, 100% of trend indicators on H4 and 90% on D1 are on their side. The picture is slightly different among oscillators. Only 65% of oscillators on both time frames are colored green, while the rest are already giving signals that the pair is overbought.
The majority of analysts (50%) have now taken a neutral position, believing that the bulls and the bears will be engaged in “tug-of-war” across the 1.2000 line in the near future. But the victory will still be with the dollar in the future. And, when moving from weekly to monthly forecast, the number of supporters of bears increases from 25% to 70%. In their opinion, the EUR / USD pair will test the support in the 1.1700 zone once again and, if successful, will drop another 100 points lower.
As for the events of the coming week, we should pay attention to Thursday April 22. The next ECB meeting will be held on that day. Any special changes in its monetary policy are not likely to be foreseen. However, the press conference of the management of the European Central Bank is of interest, during which investors can receive positive signals about the intentions of this regulator. If the business activity indicators in Germany and the Eurozone, which will be released the next day, April 23, also turn out to be encouraging, this could support the euro;

- GBP/USD. Problems after the UK's exit from the EU, an impressive trade deficit and the country's budget deficit continue to put pressure on the pound. And even the dollar, which weakened against other currencies, let the GBP/USD pair get just a sideways trend, but never return to sustainable growth.
The British currency may regain its attractiveness, especially if large capital that left it due to Brexit begins to return to the country. The pound is also supported by the successes of vaccination against COVID-19. Therefore, some analysts believe that the long-term uptrend, which began on March 20, 2020, is too early to be buried, and the pair has a chance to continue its movement to the north. 30% of experts vote for the bullish forecast at the moment. However, when switching to forecasting by the end of spring, their number doubles: up to 60%. The nearest resistance levels are 1.3920 and 1.4000.
In the meantime, the overwhelming majority of analysts, supported by graphical analysis on D1, first expect the pair to drop to the lower border of the 1.3670-1.3920 trading channel, and in case of its breakdown, the pair will move to the 1.3600 zone.
Among the events of the coming week that can influence the formation of local trends, we can note the release of statistics on the UK labor market on Tuesday April 20, data on the consumer market on Wednesday April 21, and business activity in the Markit service sector.¬ on Friday April 23. Noteworthy is the speech of the head of the Bank of England Andrew Bailey on April 21 as well;

- USD/JPY. The pair starts the next week within the zone 108.60-109.25. Recall that this is the very narrow trading range from which it could not get out for three whole weeks in March. And it is quite possible that now it will become a serious obstacle on the path of the yen to further strengthening. Graphical analysis completely agrees with this version. According to its forecast on the H4 and D1 timeframes, before continuing to move south, the USD/JPY pair will be squeezed within these limits for several days.
And 70% of analysts are sure that the pair will continue to decline. Support levels are 108.35, 107.50 and 106.00; The remaining 30% expect the pair to bounce up. Resistances are at 109.25 and 110.00, the goal is to overcome the March 31 high of 110.95 and take the height of 111.00;

- cryptocurrencies. The most optimistic forecast for the bitcoin price was given by the authors of the cult animated series The Simpsons. A running line with quotes of financial assets appears on the TV screen in the new 18th episode of season 32. The bitcoin exchange rate is marked with a green sign of infinity.
Of course, such dynamics would greatly delight investors. However, the forecasts of specialists still look much more modest. Although they also strive upward. So, according to the latest report of the Kraken exchange, its analysts, relying on historical data, admitted the growth of bitcoin by 50% in April. Taking into account that the month began at $59,000, the target of the movement could be the $90,000 mark. However, before the rally resumes, the first cryptocurrency can expect a correction of at least $10,000.
As for the second major cryptocurrency, Ethereum, Kraken predicts it could rise to $15,000. Exchange analysts noted the important, in their opinion, support and resistance levels for this altcoin: $1,462 and $2,695. Plotting historical patterns of ETH price movement on logarithmic curves, they concluded that the peak of the bullish cycle is still far away. The experts are confident that the price of Ethereum could rise by 700% from the levels of the end of March and reach a high at $15,238.
A slightly more modest forecast for the price of this altcoin was given by the famous crypto trader and host of the podcast The Wolf Of All Streets Scott Melker. According to him, Ethereum may surpass bitcoin in terms of profitability in 2021, and the price of the coin may rise to $10,000.
He revealed In an interview with Cointelegraph that he has largely switched his strategy from the first cryptocurrency to ETH in recent months. “I don’t understand why this is crazy. In fact, this is just an increase of less than five times the current price. Bitcoin almost tripled last year,” Melker told reporters. “It reminds me of investing in the Internet in the early 1990s.”
Maciej Vitkoviak looked even deeper into the history, revealing to the world a crypto-life hack of almost 40 years ago - an emulator of a vintage computer Commodore-64 from 1982, adapted for mining bitcoins. This developer has created the C64 Bitcoin Miner software specifically for this PC. He demonstrated a hashrate of 0.2 H/s on the VICE emulator, which will allow him to get a block of BTC “in just” ... 337 years and 10 months ?.
BPVyhwg.jpg

NordFX Analytical Group


Notice: These materials should not be deemed a recommendation for investment or guidance for working on financial markets: they are for informative purposes only. Trading on financial markets is risky and can lead to a loss of money deposited.

#eurusd #gbpusd #usdjpy #btcusd #ethusd #ltcusd #xrpusd #forex #forex_example #signals #cryptocurrencies #bitcoin #stock_market

Forex | Forex Trading - NordFX
 

Stan NordFX

Active member
New Mobile App from NordFX


IAyWoHa.jpg


The specialists of the NordFX brokerage company have developed a new convenient mobile app that allows you to conduct full-fledged trading in the financial markets without having to switch to other platforms.

The app supports 12 languages and contains all the functionality traders need, which they can use in just a few clicks. The trading platform integrates indicators and other tools for advanced technical analysis. In addition, the application includes an economic calendar, as well as options for opening and verifying an account, depositing and withdrawing funds.

The line of trading instruments includes 33 Forex currency pairs, gold, silver, Crude and Brent oil, as well as the main cryptocurrency pairs: Bitcoin (BTC/USD), Ethereum (ETH/USD), Ripple (XRP/USD) and Litecoin (LTC/USD).

For all the inquiries, please contact Support [email protected]

You can download the NordFX mobile app from Google Play

as well as from the App Store


Notice: These materials are not investment recommendations or guidelines for working in financial markets and are intended for informational purposes only. Trading in financial markets is risky and can result in a complete loss of deposited funds.


#eurusd #gbpusd #usdjpy #btcusd #ethusd #ltcusd #xrpusd #forex #forex_example #signals #cryptocurrencies #bitcoin #stock_market

Forex | Forex Trading - NordFX
 

Stan NordFX

Active member
Forex Forecast and Cryptocurrencies Forecast for April 12 - 16, 2021


First, a review of last week’s events:

- EUR/USD. The U.S. economy continues to recover vigorously. The S&P500 index renews another high, the value of American Treasuries is growing and, accordingly, their yield is falling. And the dollar is falling along with it.
However, the market, for the most part, is reacting not to real numbers for the last week and a half, but to forecasts and promises. As already mentioned, the US economy is growing. But the head of the US Federal Reserve said that although the March statistics on the labor market is impressive, it is not enough to even start discussions on the curtailment of fiscal stimulus programs. According to Jerome Powell, this requires several more months of such positive results.
His colleagues agree with him. So, the head of the Federal Reserve Bank of San Francisco Mary Daly noted that the US economy is still very far from the recovery, and the Fed will wait until this happens. And the head of the Federal Reserve Bank of St. Louis, James Bullard, said that one should not even think about changes in the US monetary policy until the end of the COVID-19 pandemic.
But as for the other side of the Atlantic Ocean, there are more and more vigorous statements of EU officials about the imminent termination of lockdowns and the unprecedented growth of the Eurozone economy. And in spite of the calls of German Chancellor Angela Merkel for tighter isolation, optimistic data on industrial production in this country are cited.
As a result of all these verbal battles, the scales tipped to the side of the euro. As predicted by most experts, the EUR/USD pair went up, rising to the height of 1.1930 on Thursday, April 08. This was followed by a correction and a finish at 1.1900;

- GBP/USD. Problems after the UK's exit from the EU, an impressive trade deficit and the country's budget deficit continue to put pressure on the pound. And even the dollar, which has weakened against other currencies, does not allow the GBP/USD pair to return to growth. We see how the British currency, step by step, is losing ground starting from February 24. Last week the pair was able to grow only to 1.3920. This was followed by a reversal and, as predicted by graphical analysis, it dropped to the level of 1.3670. As for the final chord, it sounded at the height of 1.3710;

- USD/JPY. It has been repeatedly written that the rate of this pair is greatly influenced by the yield of US Treasuries. Fluctuations in the yield of these securities allowed the yen to straighten its shoulders a little and win back 165 points from the dollar in the first four days of the week, dropping to 109.00. However, then the strength of the bears dried up, and the pair ended the five-day period at the level of 109.65;

- cryptocurrencies. The overwhelming majority of analysts (70%) gave a negative forecast for the BTC/USD pair last week, expecting it to move towards $50,000. This is exactly what happened, and the fall of bitcoin on Wednesday to $55,540 made many talk about the beginning of new "crypto freezes". Fortunately for investors, the panic was premature and the pair returned to the $58,000 zone on Friday. However, the question of why the main cryptocurrency failed to gain a foothold above $60,000 remains open.
One of the versions is a drop in demand from large institutional investors. But, as is clear from the statistics of crypto exchanges, "whales" continue to withdraw cryptocurrency to cold wallets. And therefore, they expect its growth to continue.
The miners' actions are also indicative of their bullish sentiment. They switched to hoarding coins in April, creating a shortage in the market. The movement of cryptocurrency from miners to crypto exchanges has decreased by almost 40%: from 450 bitcoins per day in March to 275 in the first decade of April. Naturally, such a shortage of supply should push the price up. Suffice it to recall that the BTC/USD pair rose from $19,000 to $30,000 in a similar situation the previous time.
In the meantime, just as bitcoin cannot take the $60,000 height by storm, the total market capitalization cannot step over the $2.0 trillion bar either, once approaching it, once moving away. At the time of writing this review, on Friday April 09, it has once again come close to this important psychological level, reaching a volume of $1.990 billion. As for the Crypto Fear & Greed Index, it has changed only by 4 points during the week, having fallen from 74 to 70.
It should be noted that the share of bitcoin in the total crypto market capitalization is continuously decreasing: if it was 62% on March 14, then it was only 55% on April 09. This is undoubtedly due to the lack of positive price dynamics for BTC/USD. Speculators are switching to other instruments, which allow making serious profits at the moment. And here the ripple should be noted.
When the ripple fell to $0.170 at the very end of December 2020 due to the claims of the Securities and Exchange Commission (SEC), many gave up on it. However, on April 7, at the high, the price of this altcoin reached $1.108, showing a 550% gain since the the year started. Its capitalization also grew during this time, rising from 1.40% to 2.42%. The reason for this rally, especially in the last week, was the news that ripple's lawyers have gained access to the SEC documents and are making serious progress in litigation with this powerful regulator.


As for the forecast for the coming week, summarizing the views of a number of experts, as well as forecasts made on the basis of a variety of methods of technical and graphical analysis, we can say the following:

- EUR/USD. As is said in the first part of the review, the statements of the US Federal Reserve leaders, the growth of the stock market and the fall in the yield of US Treasury bonds are important factors. But they are limited in time. So is the falling dollar. And at some point, everything can turn 180 degrees. The higher the US stock indices soar - Nasdaq, Dow Jones, S&P500, the more frequent talk about “soap bubbles” that are about to burst. Investors borrowed a record $814 billion secured by their own portfolios by the end of February 2021. And this is 49% more than a year ago. A similar situation resulted in the collapse of the stock market and in the economic crisis in 2008.
But until this happens, the attractiveness of the dollar continues to decline, which plays into the hands of low-income currencies and, first of all, the euro. The dollar is not facilitated by the confrontation between Democrats and Republicans in the US Senate over the scale of further fiscal stimulus either.
Of course, a way out of this political stalemate will be found, and there will be more clarity about the results of vaccinations and the speed of recovery of the US and Eurozone economies. But according to forecasts of 65% of experts, the EUR/USD pair will continue its growth in the coming week. This scenario is supported by 75% of oscillators and 85% of trend indicators on H4. The advantage of the “greens” is much weaker on D1, here it is only 65% of technical indicators that point to the growth of the pair. At the same time, 15% of oscillators are painted neutral gray, and 20% already give signals about the pair being overbought.
As for the graphical analysis, it shows movement in the 1.1835-1.1950 trading range on H4, the range is, of course, wider on D1: first, the pair goes down to the lower border in the 1.1700 zone, and then rises to the 1.2000 height. It should be noted that in the transition from weekly to monthly forecast, 55% of analysts vote for the decline of the pair to the horizon of 1.1700.
As for the events of the coming week, we should pay attention to inflation indicators and data on the US consumer market (due out on April 13, 15 and 16), Eurozone (April 12) and Germany (April 15) . Also of interest is the speech of the head of the US Federal Reserve Jerome Powell on Wednesday April 14;
JoIvBgm.jpg

- GBP/USD. At the moment, the absolute advantage for this pair is on the side of the bears. 85% of oscillators and 100% trend indicators on H4 are painted red. On D1 it is 85% and 80%, respectively. 65% of analysts also vote for the further fall of the pair. The nearest support is 1.3670, the target is a transition to the zone 1.3575-1.3610. Graphical analysis on D1 also draws the continuation of the downward trend. However, according to its forecast, the pair may rise to the resistance level of 1.3900 before heading south.
Even though the sell-off of the pound continues, many analysts note that the long-term uptrend, which began on March 20, 2020, has not been affected. And the fall of the last 6 weeks can be considered as a correction, after which the British currency may continue its growth. The pound will regain its attractiveness, especially if large capital that left it due to Brexit begins to return to the country. The pound is also supported by the successes of the early stages of vaccination against COVID-19. In this case, according to 70% of experts, the GBP/USD pair has many chances to regain its lost positions and return first to the 1.4000 zone, and then retest the February 24 high at 1.4240 before the end of spring;

- USD/JPY. Back in early March, the volumes of purchases of futures contracts for the yen exceeded sales. But the fast pace of the US economic recovery has changed everything. According to the Commodity Futures Trading Commission (CFTC), the number of short contracts on Japanese currency began to grow since mid-March, reaching record values since January 2019.
At the moment, despite the confusion in the indicators' readings, the majority of experts (65%), supported by graphical analysis on H4, expect further weakening of the yen and the return of the USD/JPY pair, first to the level of 111.00, and then its rise another 100 points higher, to the level of 112.00.
The remaining 35% of analysts are looking south, expecting to see how the pair will test 108.40 support. Moreover, when moving to the monthly forecast, the number of bear supporters increases to 60%, and the target shifts to the zone 105.00-106.20.
As for the events of the coming week, one can note the speech of the head of the Bank of Japan Haruhiko Kuroda on Wednesday April 14, from which the market will wait for signals regarding the monetary policy of the regulator for the near future. Recall that the Bank of Japan has not been able to decide how to respond to rising yields on US securities and what to do with its own. If the yield on 10-year US bonds and commodity prices continue to rise, and the regulator does not respond to this, it could hit the yen even harder. And it has already suffered quite tangible losses, having lost more about 700 points to the dollar over the past three months.

- cryptocurrencies. The news background of the past week was quite versatile. Thus, the investment bank Morgan Stanley has filed an application with the US Securities and Exchange Commission (SEC), according to which 12 funds of the bank will be able to invest in BTC. Each of the funds indicated in the application will be able to place up to 25% of the capital in the first cryptocurrency. And that's good for investors.
On the other hand, the billionaire and founder of PayPal, Peter Thiel, declared out of the sudden that bitcoin has become an instrument of China's policy and is increasingly hitting the dollar. That is why, according to Peter Thiel, the US government should attend to the regulation of this benchmark cryptocurrency. It should be noted that this businessman previously supported bitcoin, and now one needs to understand who or what made him change his mind. And if the wind blows from the White House, this is a very negative signal for the cryptocurrency market.
As for the forecasts, experts of another large world bank, JPMorgan, called the long-term target for the bitcoin rate of $130,000, having lowered the bar from $146,000 due to the fall in gold quotes. Analysts made such a forecast based on the calculation of the theoretical capitalization of the first cryptocurrency in case of an influx of funds from the market of precious metals.
In general, the topic of comparing bitcoin with gold, for which cryptocurrency is becoming a digital alternative, sounds more and more often. Many bitcoin bulls in the expert environment say that BTC will be able to bypass gold in terms of capitalization in the future. In this case, the value of all bitcoins should grow 10 times and exceed the $11 trillion mark. And according to analysts at Ark Invest, that could happen within the next few years. "We believe that bitcoin is better than gold and it's safe to say that it will capture a gold market share or even more."
Billionaire and founder of the crypto bank Galaxy Digital Mike Novogratz agrees with the forecast of Ark Invest. He stated In a comment for CNBC that he was shocked by the pace of digital asset adoption. The investor also admitted his previous forecast of the price of the first cryptocurrency of $60,000 too conservative. “Bitcoin is on the inevitable path to reaching and exceeding the capitalization of gold,” said Novogratz.
Quite an astronomical forecast was given by the author of the book “Rich Dad, Poor Dad”, investor and entrepreneur Robert Kiyosaki. He suggested in a recent interview that the first cryptocurrency could reach a value of $1.2 million in the next five years. Kiyosaki first bought bitcoin last year after the pandemic effectively shackled the global economy. It was then trading at $9,000. “I wish I could buy it for 10 cents, like many people did, but I still look like a genius because today it costs about $55,000. I think that in another five years it will grow to $1.2 million,” the entrepreneur announced.
At the same time, even though Kiyosaki, opposite to Peter Thiel, has turned into a defender of bitcoin, he still prefers gold and silver for main investments, explaining this by the fact that the cryptocurrency is outside the regulatory field.
And finally, at the end of the review, another crypto life hack. This time, it's about how to make money without "mining", without buying or selling cryptocurrency. After all, it turns out that it is enough just to look into the future and register a promising Internet address in time in order to become a millionaire. So, domain name registrar GoDaddy put up Roger Ver's Bitcoin.com domain for sale for $100 million earlier last week. However, this time the deal fell through: upon discovering the ad, the owner declared that it was “100% fake" and demanded to remove the domain from sale. But this does not mean that you will not be able to earn a tidy sum at other addresses. After all, there are still so many promising cryptocurrencies in the world besides bitcoin.


NordFX Analytical Group


Notice: These materials should not be deemed a recommendation for investment or guidance for working on financial markets: they are for informative purposes only. Trading on financial markets is risky and can lead to a loss of money deposited.

#eurusd #gbpusd #usdjpy #btcusd #ethusd #ltcusd #xrpusd #forex #forex_example #signals #cryptocurrencies #bitcoin #stock_market

Forex | Forex Trading - NordFX
 
Top